Using Looker Studio SEO dashboard GSC, a digital marketing agency specialising on SEO needed a way to report on organic traffic that they were bringing to their client website.
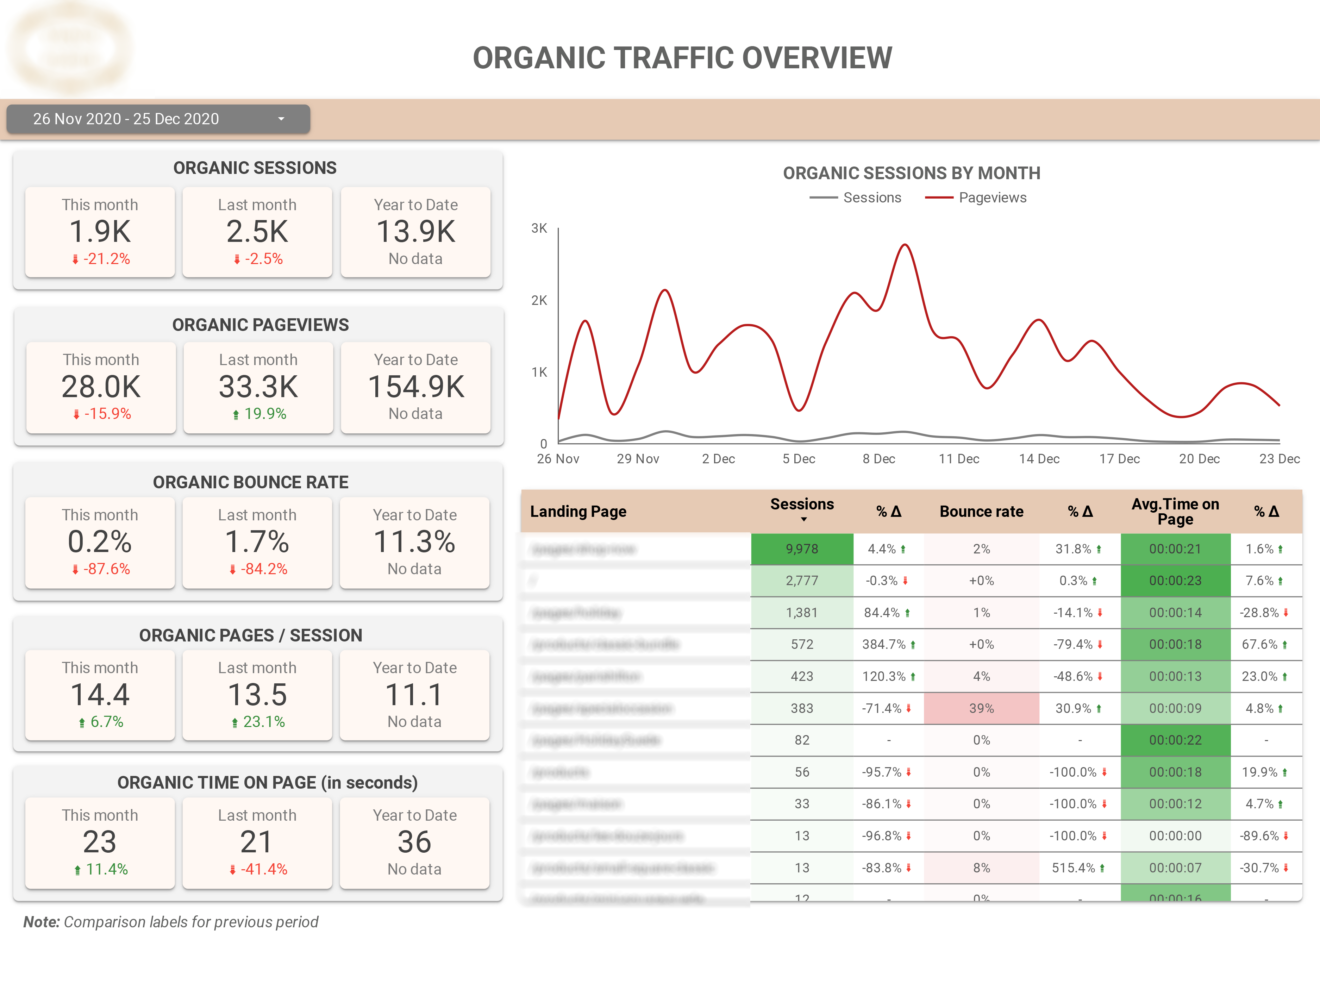
Key metrics such as organic sessions, pageviews, bounce rate and time on page are shown for this month, last month and last year.
Page-level analysis is shown for sessions, bounce rate and average time per page
The trend for number of sessions and pageviews is shown on daily basis
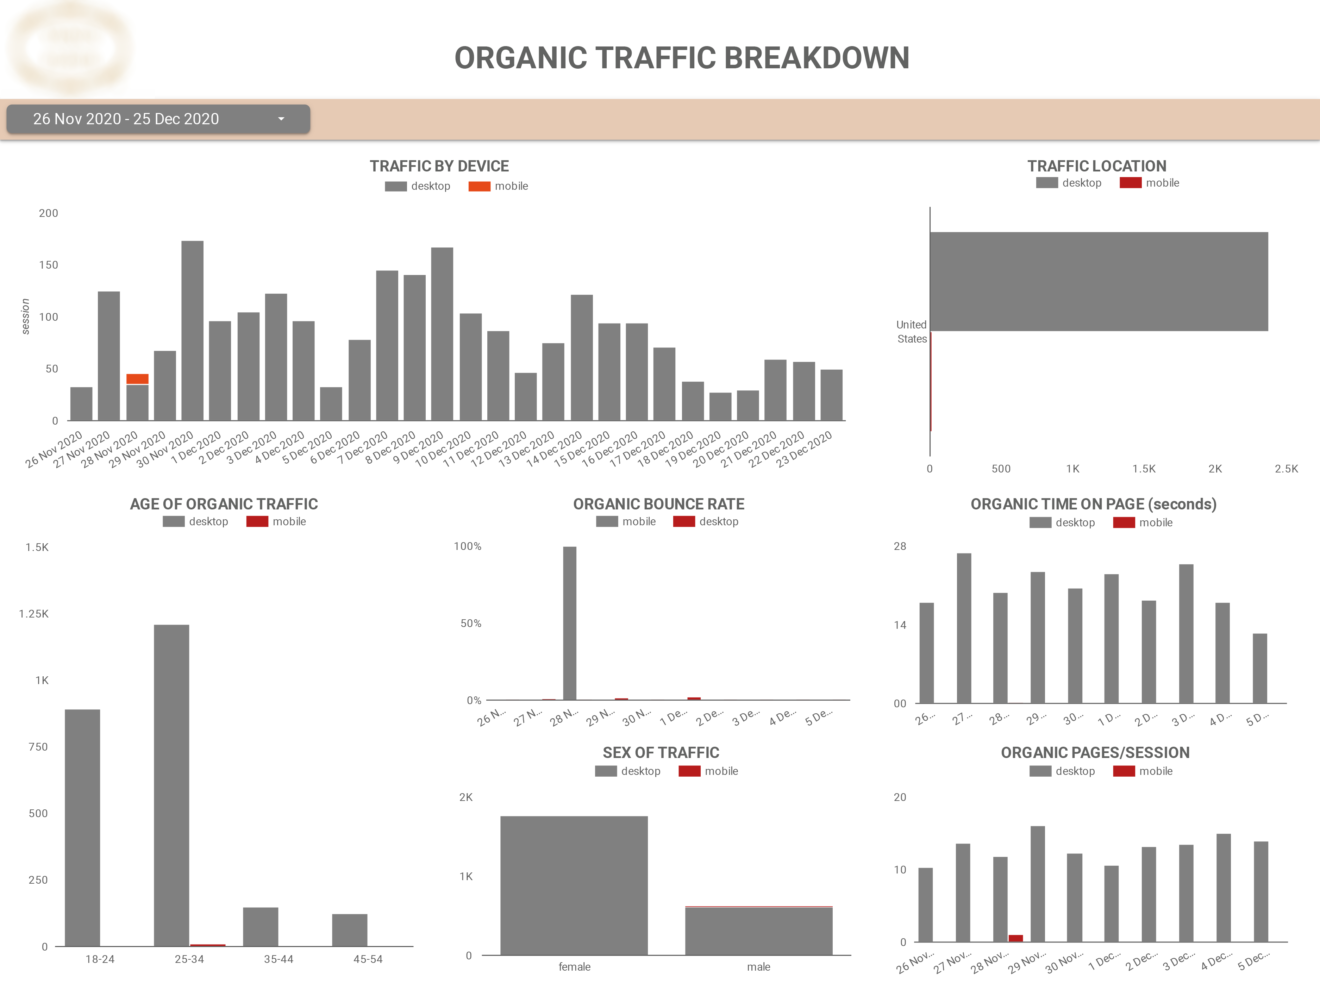
Some demographic analysis is done for organic traffic including sex, device, location and age.
Trends for number of sessions, organic time on page and pages per session are visualised.
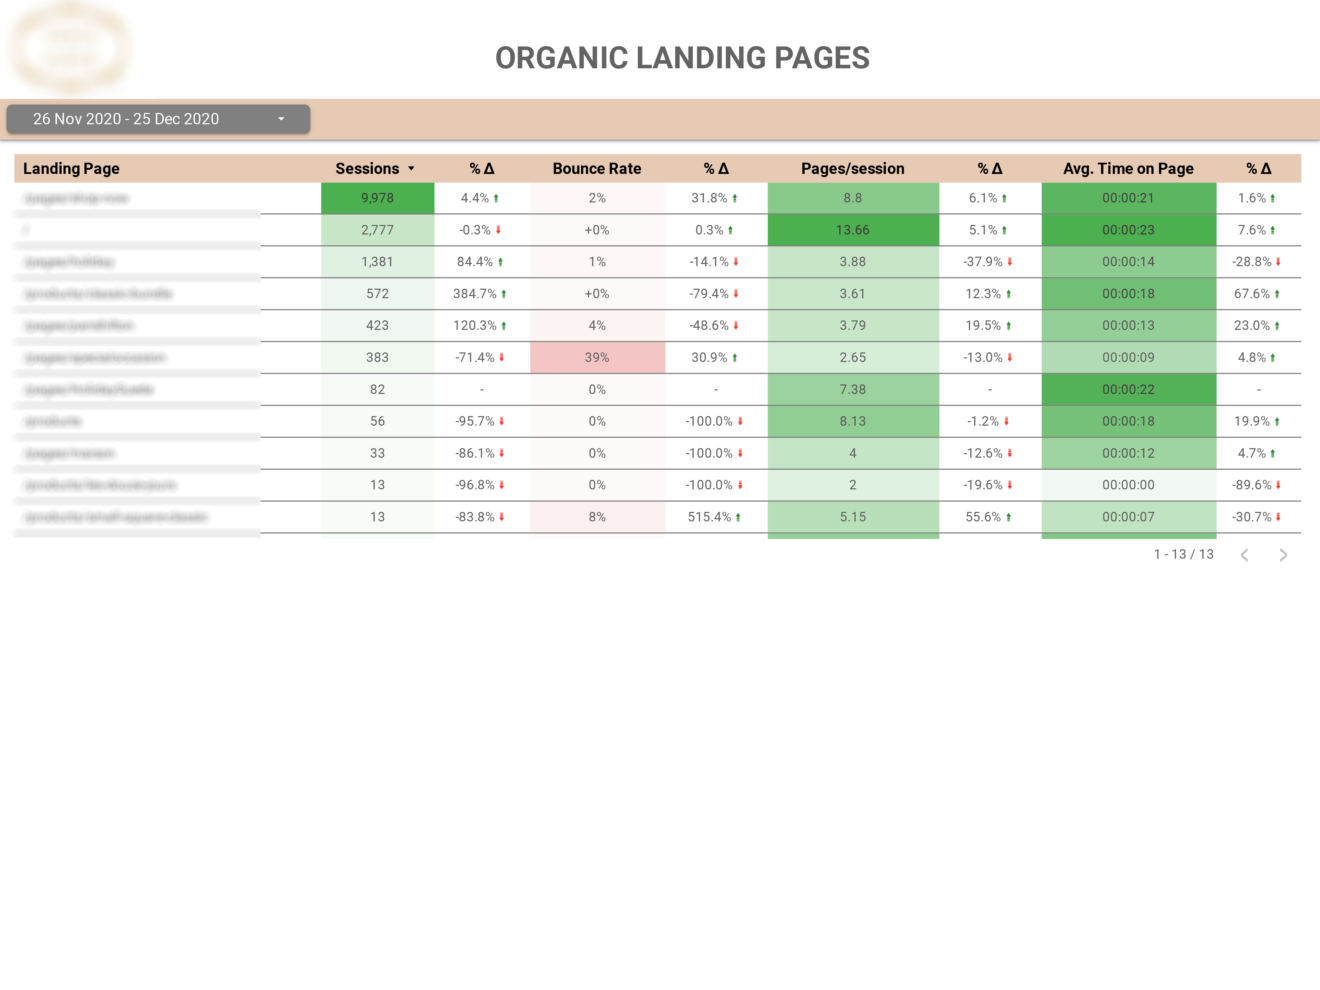
Sessions, bounce rate, pages/session and average time on page is broken down by landing page
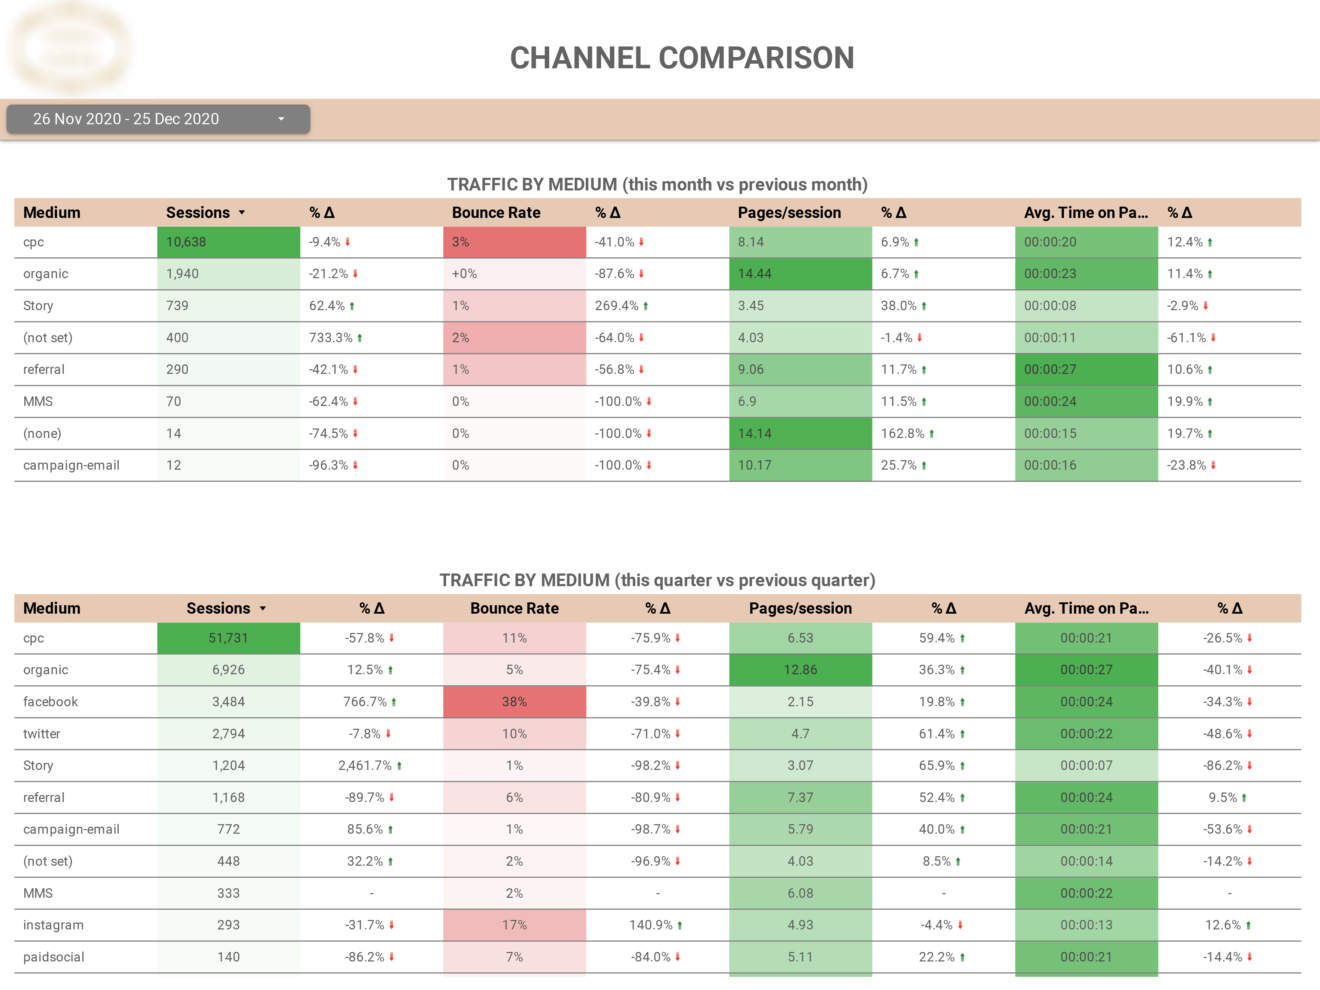
Traffic by medium source is analysed to determine which source has most sessions, pageviews per session, has highest average time on page
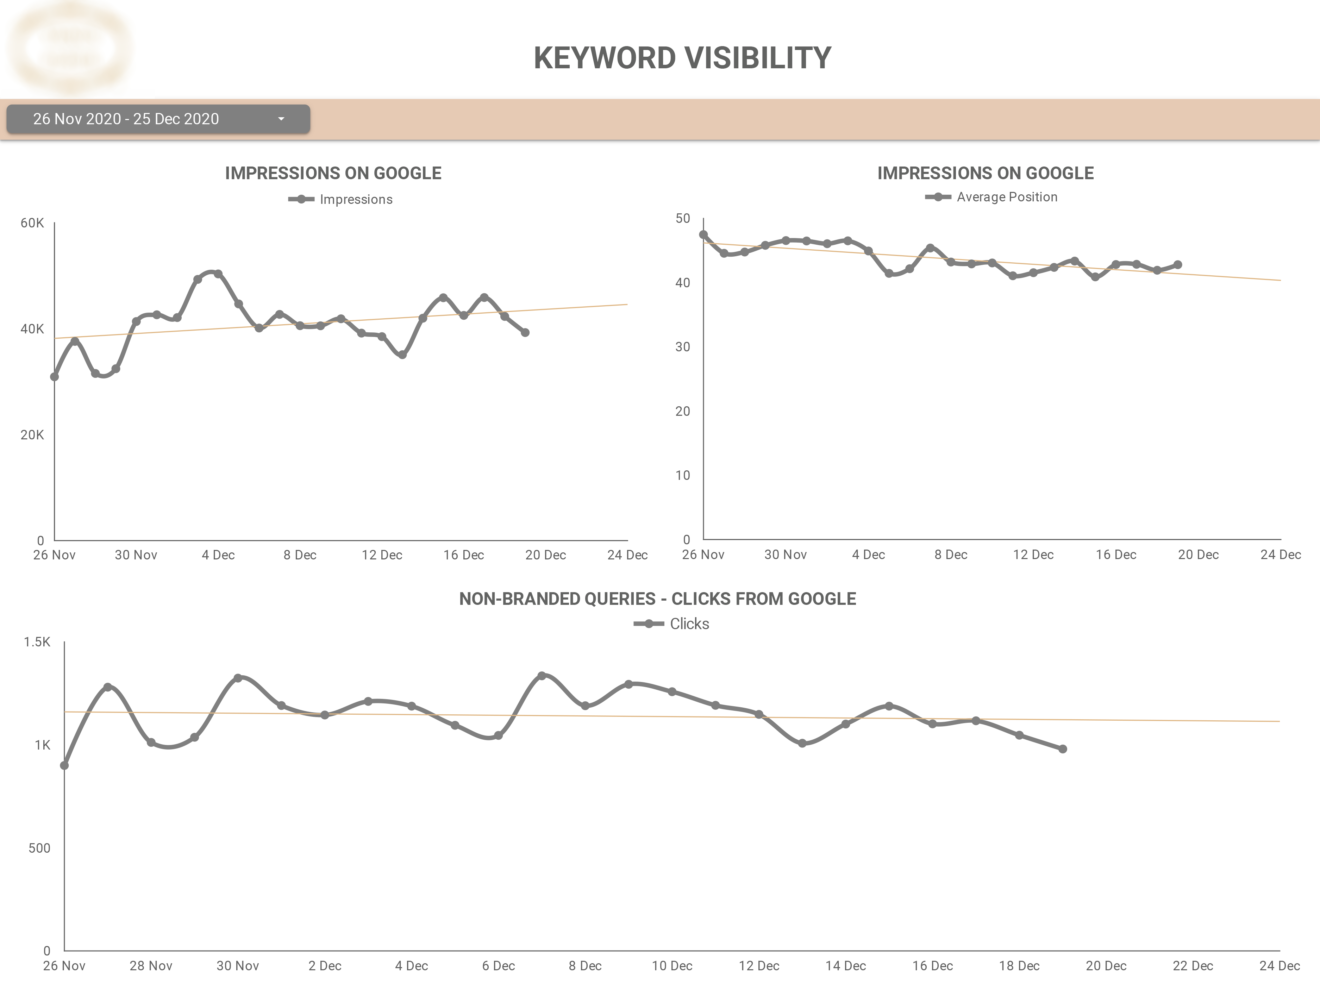
Daily trends are shown for number of impressions and average position on google.
Clicks on non-branded queries in google are shown as a daily trend
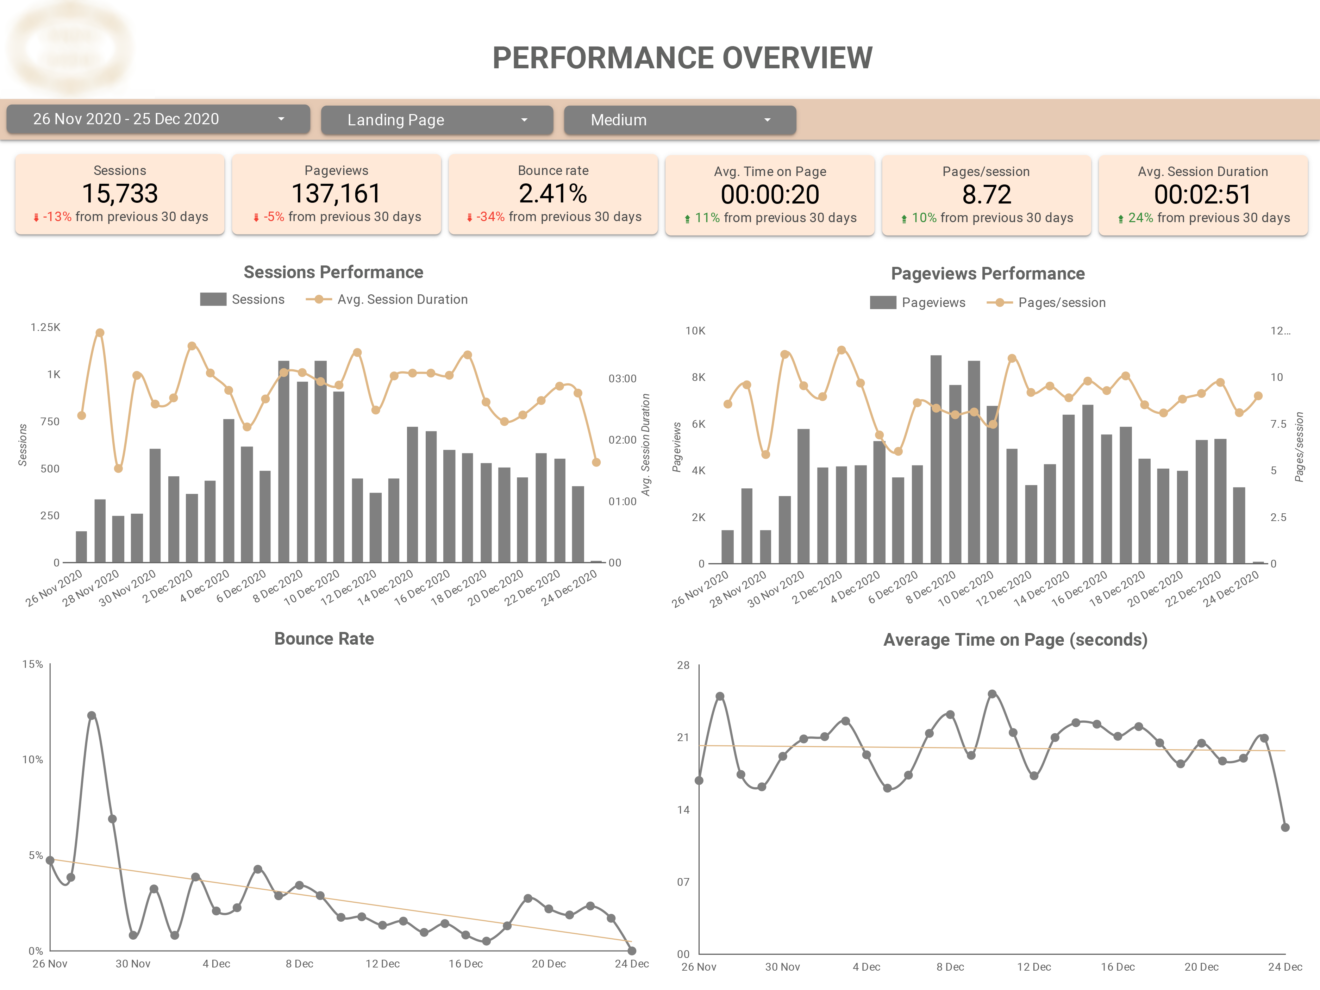
High level metrics are presented on the top with comparison to the last 30 days.
Daily trends are shown for sessions, pageviews, bounce rate and average time on page
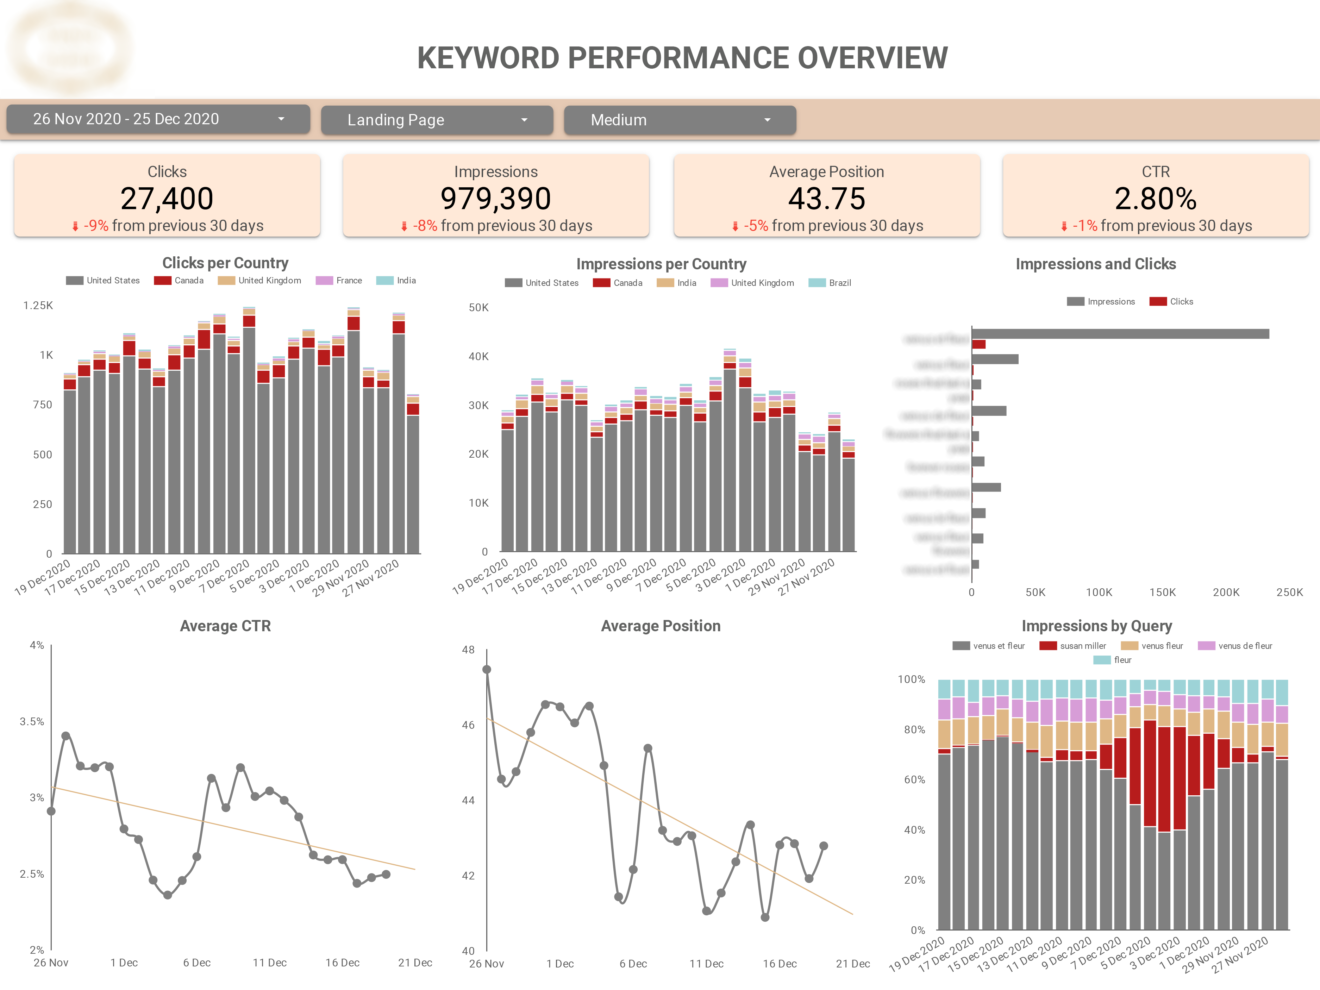
Clicks, impressions, click-through rate and average position are analysed on this page.
Daily trends for these metrics are also broken down by country
Looker Studio offers several advantages for creating SEO dashboards:
Support
All the support you need – when you need it. From 1-hour quick fix support to longer-term partnership that drives your business forward.
Consultancy
Advanced data thinking, creative ideas and the best Power Platform practices to unlock the true potential of your business data.
Training
Succeess shouldn’t be a one-off. When we train you teams user adoption surges and your Power Platform results radically improve.