The Financial Director of Tikkurila reached out to us in order to get help with building their Power BI finance dashboard. This Power BI dashboard is designed to support the sales and finance departments. The created Power BI dashboard is used for analysing the financial performance of the sales organisation.
Data Source
Dynamics NAV database, Excel
Analysis Tool
Power BI
The Finance Director of Tikkurila started by creating the Finance Power BI dashboard himself but got stuck with making the numbers match and creating a good-looking dashboard. He then approached our Power BI consultancy for finishing the dashboard and improving the visual interface.
This Finance Power BI dashboard was then used in weekly team meetings for assessing whether the sales team is moving in line with the target and monthly/annual forecasting.
If you are looking to create a similar Power BI finance dashboard for your company, contact us now!
Power BI functionality is very-well suited for financial analysis due to advanced data transformation capabilities and ability to handle large dataset. In this particular case the dataset volume was over 300 MB and it needed significant data transformation.
Power BI also natively integrates with Dynamics NAV which is where the client stored their financial data.
These core features made the Power BI the tool of choice to create a Finance dashboard for Tikkurila.
Direct Sales Organisation relates to the sales that the sales reps are making through cold outreach to potential clients. This page enables the Financial Director to analyse the performance of the sales organisation and identify high-performing sales reps and areas of the UK.
The revenue is analysed by region and presented in a heatmap so that the user can quickly compare regions to each other as well as the table so that the user can read the exact number. This enables the sales team to identify which areas of the UK should be targeted more.
Revenue and profit are broken down by salesperson, sales team and payment method. This enables the financial director to identify which salespeople bring in highly profitable deals and negotiate favourable payment terms.
Finally revenue for this year is broken down by month, compared to prior year and target for this year. This analysis enables the Financial Director to track whether the sales organisation is performing well vs target.
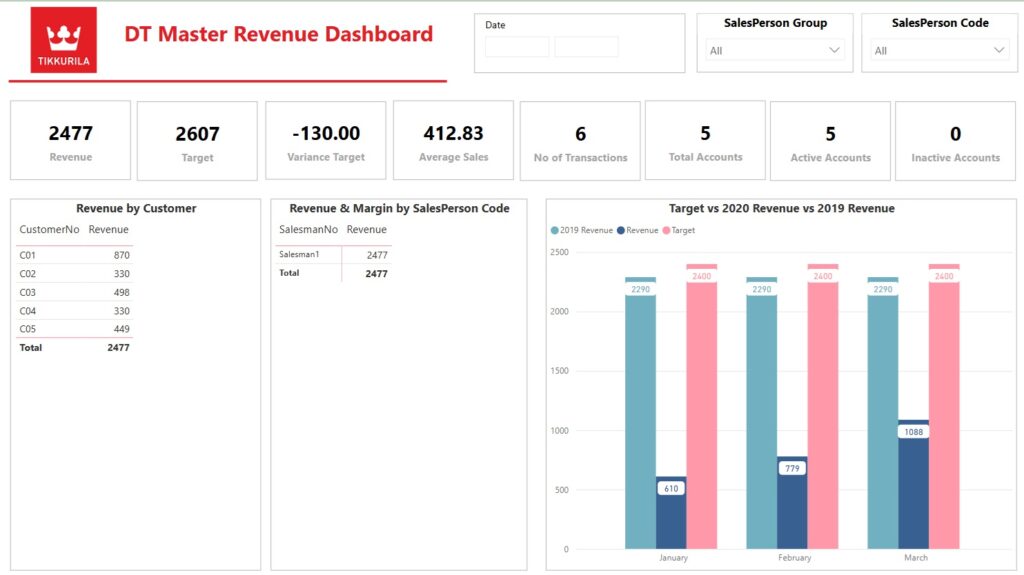
This Power BI finance dashboard page is used specifically for sales rep analysis. The filters at the top enable the users to filter the dashboard by salesperson group which would allow to evaluate the sales manager performance. The salesperson filter can be used to evaluate a particular sales rep.
This page can be used to see how many assigned accounts are active meaning that there were sales for these accounts in the selected time period. You can also see the number of transactions for these accounts, revenue from them and how this revenue compares to targets.

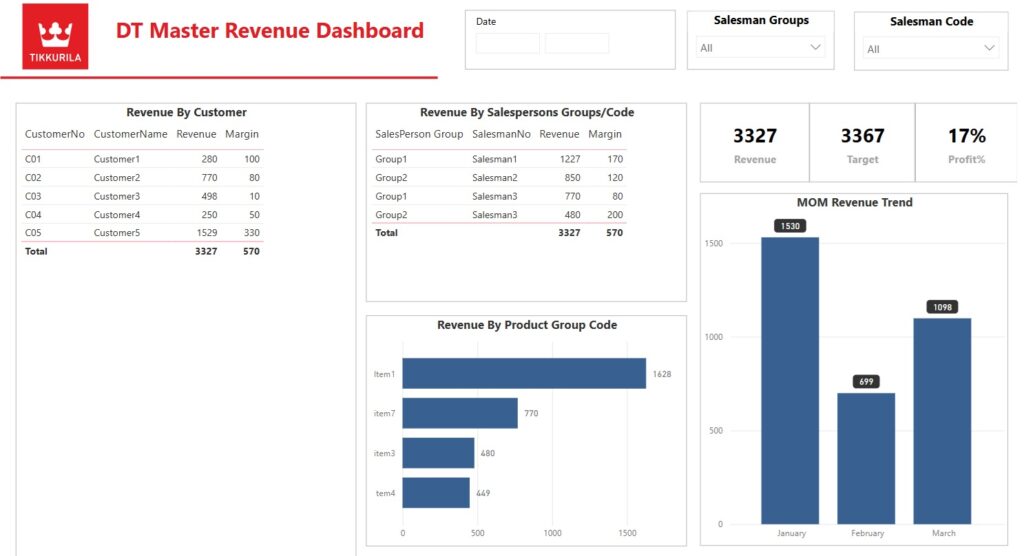
This Power BI finance dashboard page analyses the revenue by product groups to enable the Finance Director to identify winning products and suggest promotions around them.
The Finance Director could also filter the dashboard by sales group and salesman code to identify whether certain people are getting better at selling the products over time.

Our Power BI consultancy has created 500+ Power BI dashboards for clients in all industries. Some members of our team have partial ACCA qualification and several years of financial analysis experience.
Simply reach out to us today to discuss the dashboard that you want to create and let the professionals do the work for you!
Support
All the support you need – when you need it. From 1-hour quick fix support to longer-term partnership that drives your business forward.
Consultancy
Advanced data thinking, creative ideas and the best Power Platform practices to unlock the true potential of your business data.
Training
Succeess shouldn’t be a one-off. When we train you teams user adoption surges and your Power Platform results radically improve.