A sales department wanted to visualise activity of sales reps on weekly and monthly basis. The intention was to create a Power BI Netsuite dashboard that could be displayed on a TV in the office
Data Source
Netsuite
Analysis Tool
![]() Power BI
Power BI
A third party connector was used to connect Power BI directly to NetSuite. The data connection is direct, the refresh is automatic and scheduled for every working hour,
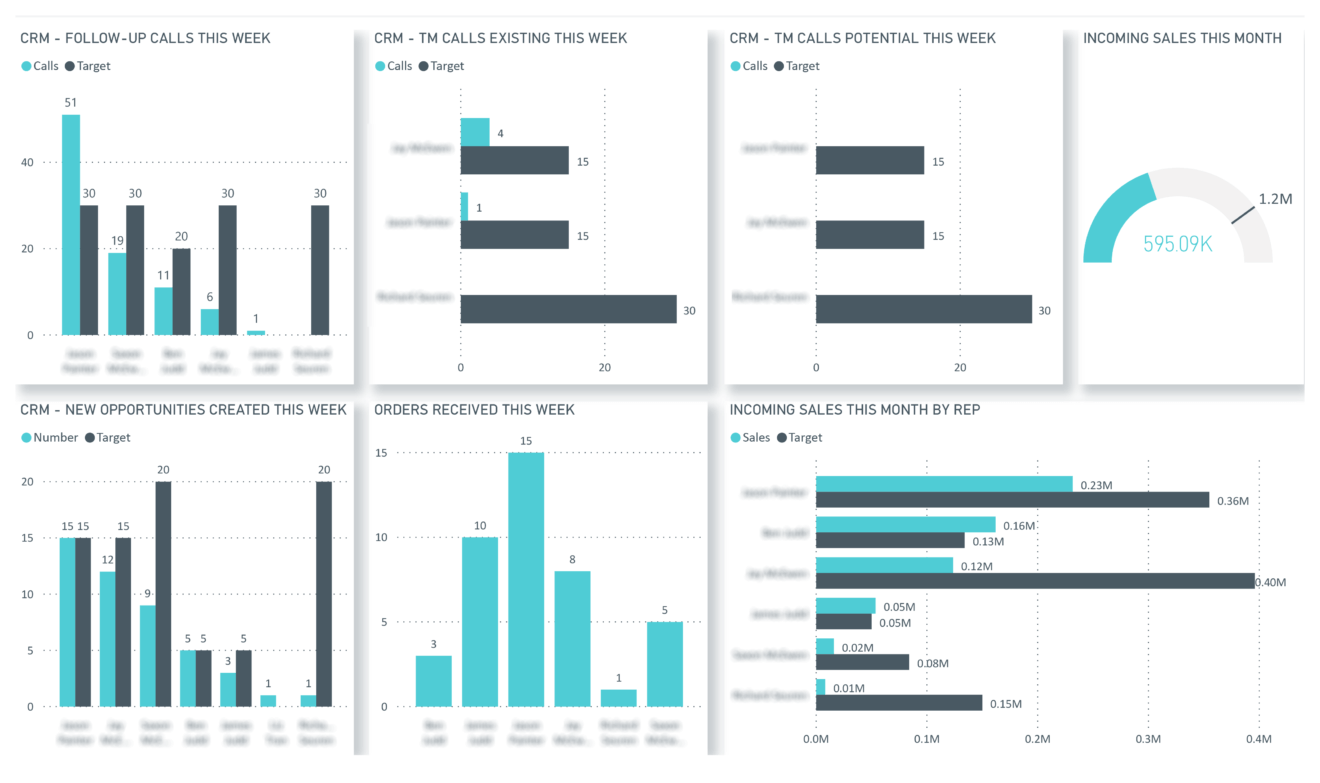
The number of calls is broken down by sales rep. The actual number of calls is compared to target which makes it easy to see if someone is underperforming.
Created opportunities and won opportunities are also broken down by sales rep.
The progress on the whole sales organisation towards target is also analysed.
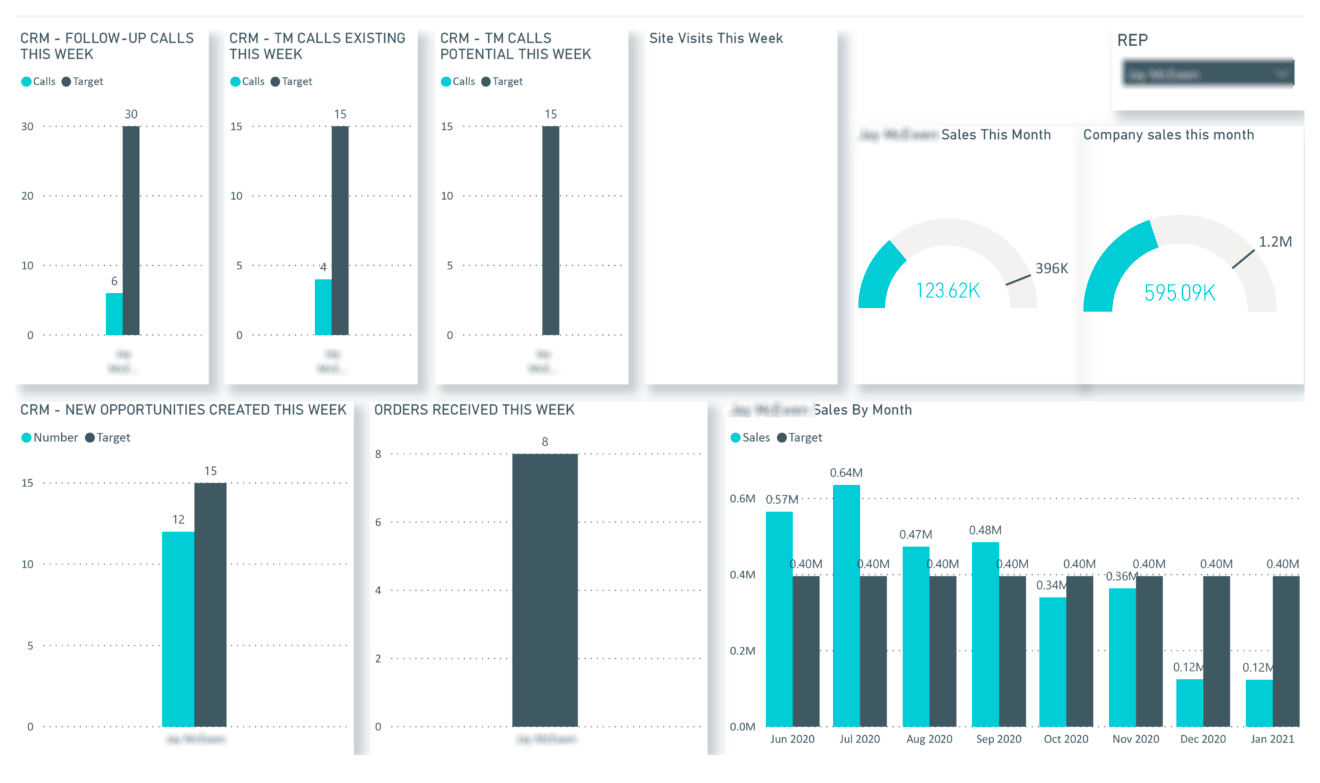
A filter at the top is added for a specific sales rep.
Number of calls, orders and progression towards target are shown by selected sales rep.
Actual sales vs target are also shown by month.
Integrating NetSuite with Power BI offers numerous benefits that can significantly improve business operations and overall efficiency. Here are the key reasons why this integration is beneficial for businesses:
Although NetSuite has some useful built-in reporting capabilities, Power BI provides advanced data visualisation capabilities. Power BI allows users to create custom dashboards tailored to specific business needs. This makes it easier to interpret complex data and gain insights.
This integration provides real-time data synchronisation between platforms. This ensures that businesses to have access to the most up-to-date information.
Power BI is able to handle large datasets. This ensures that businesses can continue to derive value from data as they expand.
Power BI ensures that sensitive data is securely transferred and stored. This helps businesses to protect their information and to comply with regulatory requirements.

Support
All the support you need – when you need it. From 1-hour quick fix support to longer-term partnership that drives your business forward.

Consultancy
Advanced data thinking, creative ideas and the best Power Platform practices to unlock the true potential of your business data.

Training
Succeess shouldn’t be a one-off. When we train you teams user adoption surges and your Power Platform results radically improve.
![]()
![]()
![]()