The client actively uses influencer marketing to promote their products. The scope of work was to analyse how much revenue and LTV each influencer is bringing to the company.
Data Source
Hubspot, Google Analytics
Analysis Tool
![]() Google Data Studio
Google Data Studio
We wrote our own Python scripts to extract data from Hubspot and Google Analytics into Big Query.
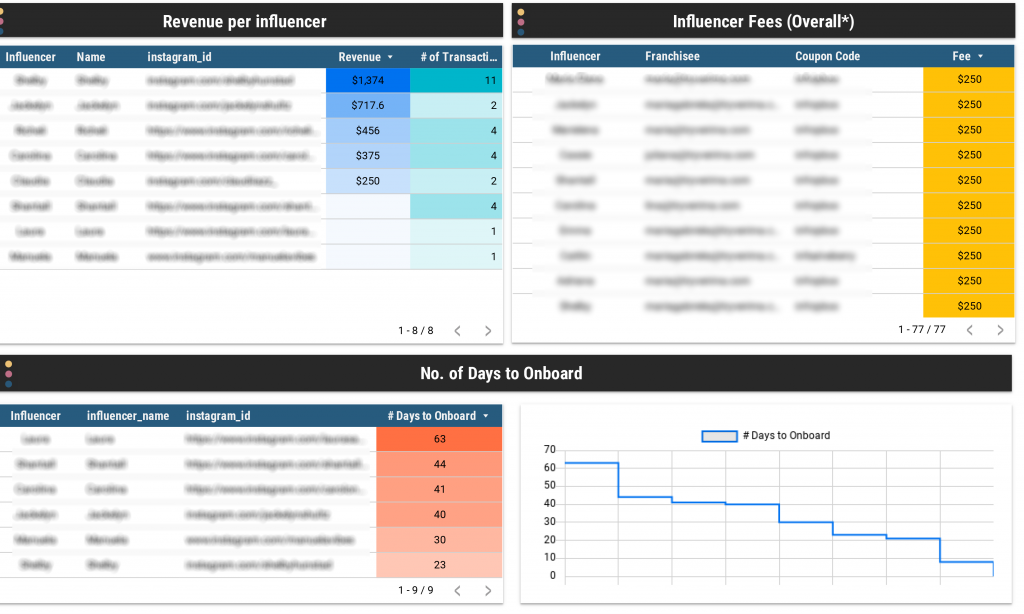
Revenue that each influencer brings in is visualised as well as commission that is paid to the managers that are in charge of influencer marketing.
The influencers are paid in products. The average cost in product equivalent is shown

The fees paid to each influencer and number of days to onboard an influencer is shown below
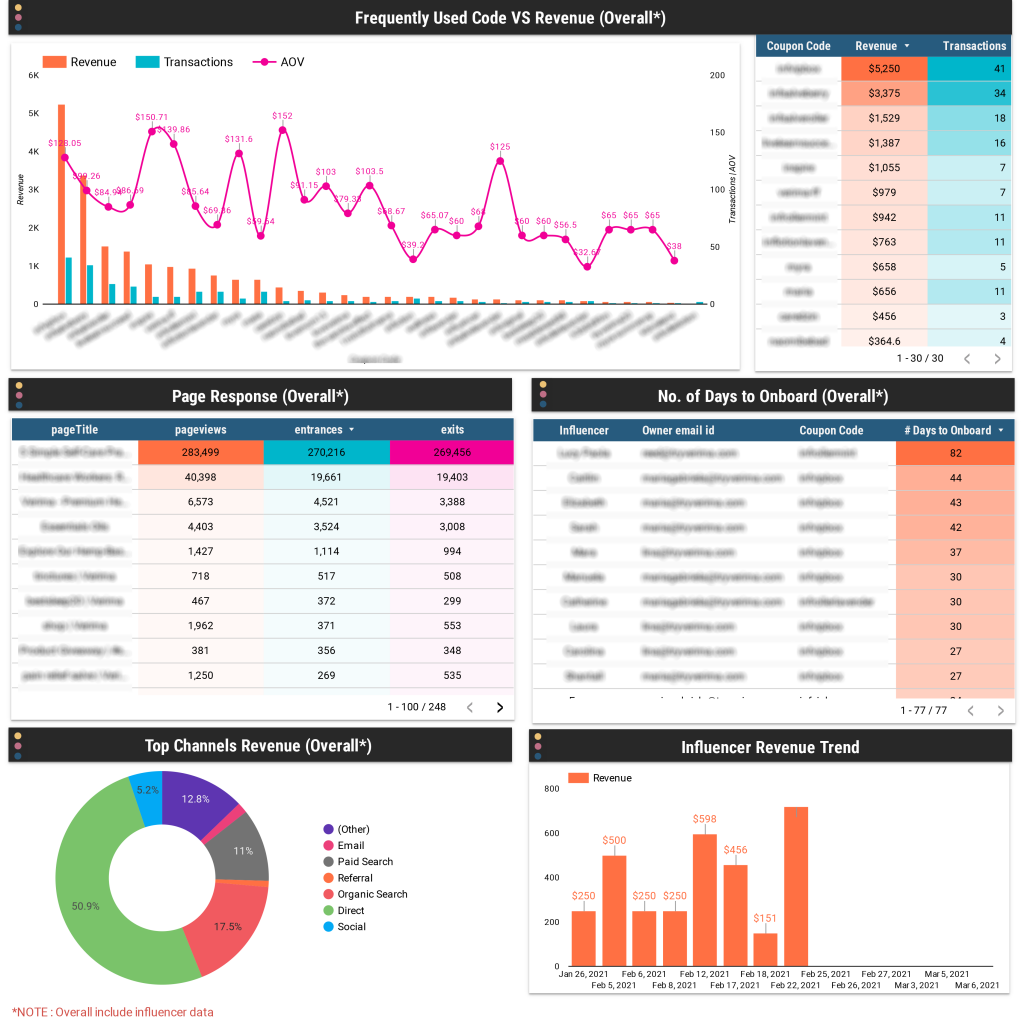
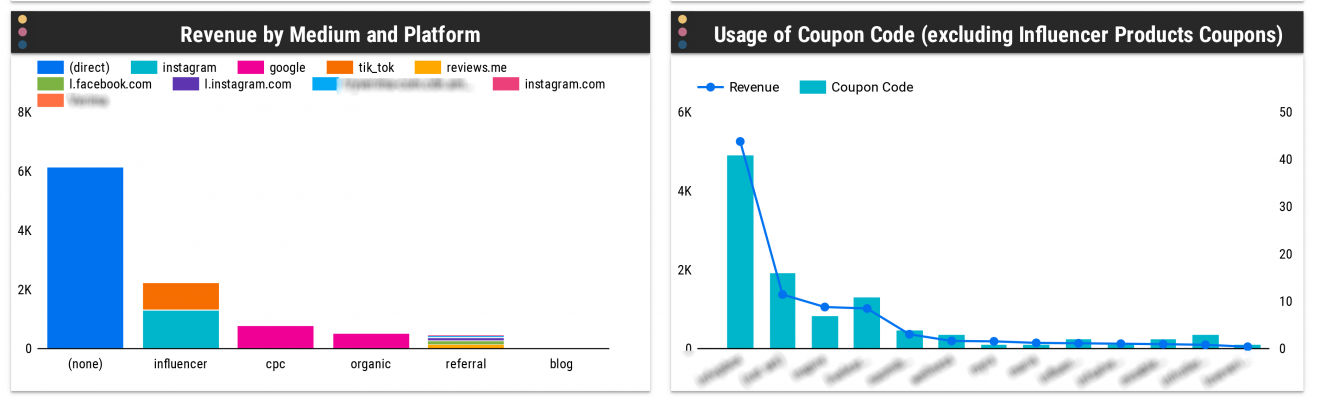
Revenue, transactions and AOV are broken down by coupon code.
Pageviews, entrances and exits are broken down by page on the website.
Revenue is broken down by channel and day.
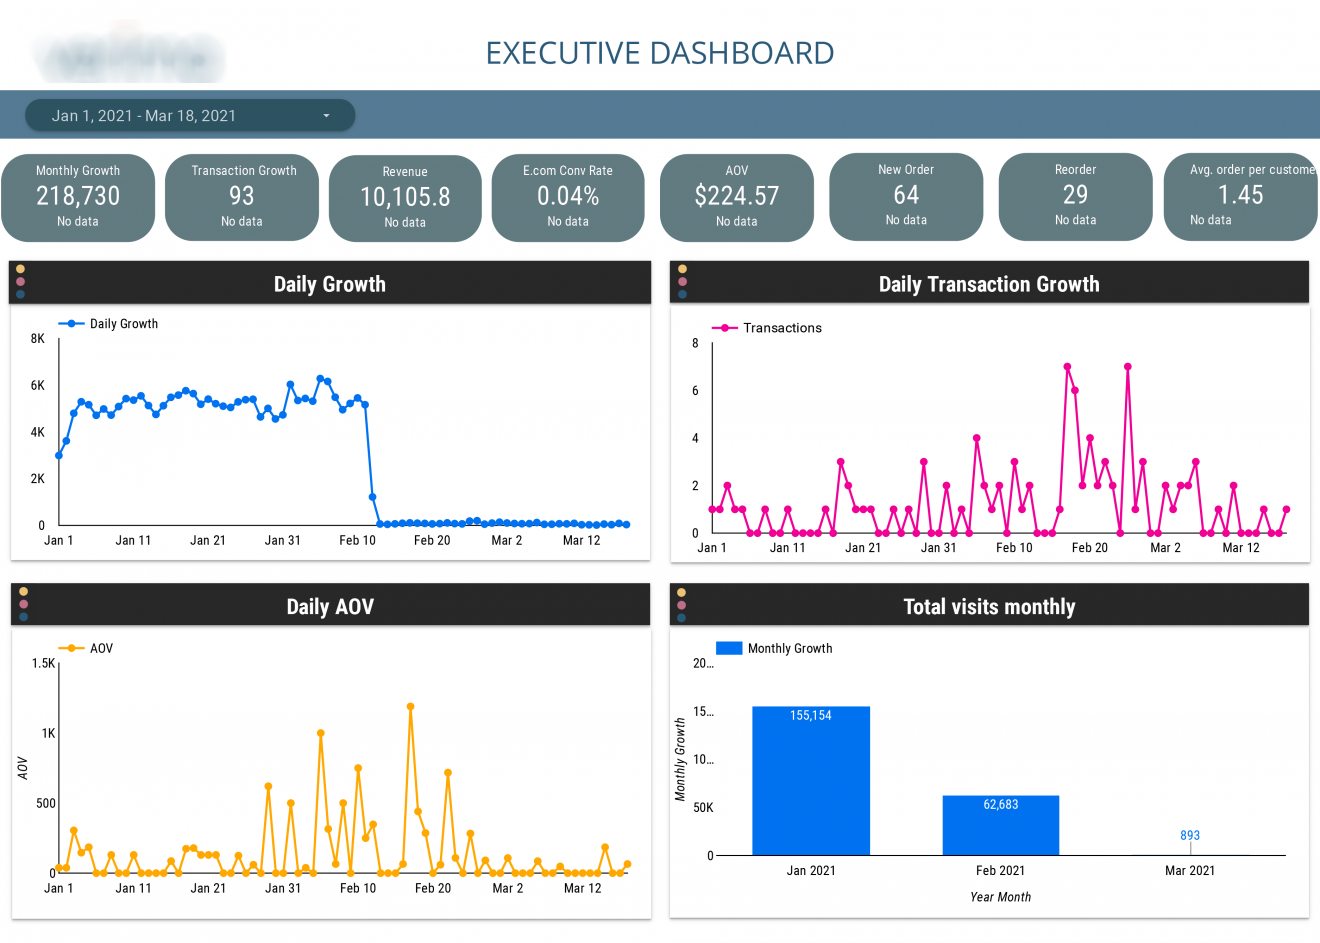
High-level metrics are shown at the top. The daily and monthly trends for some of these metrics are shown below.
Life-time value is calculated for each influencer platform (Instagram and Tik Tok) as well as traffic channel (direct, Instagram and etc)
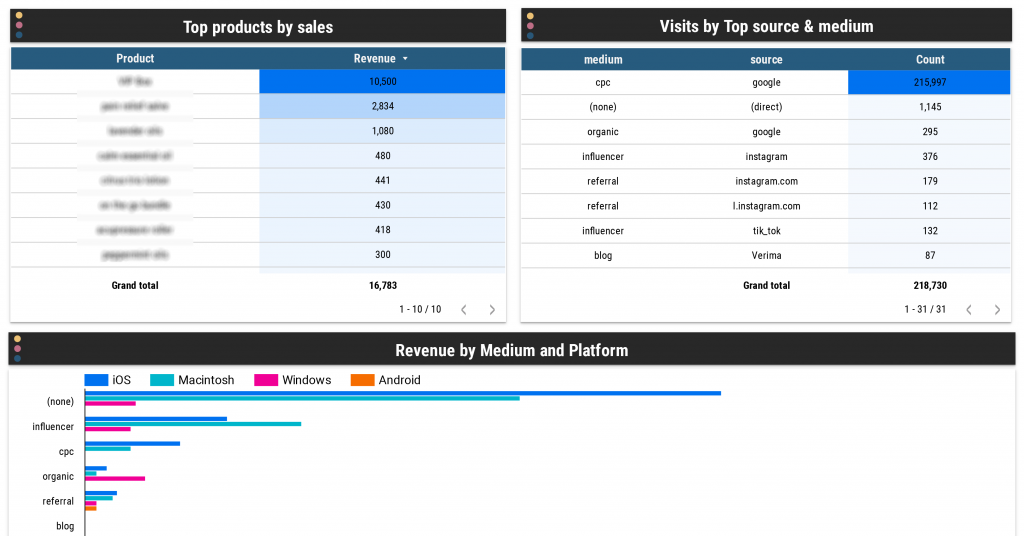
Revenue is also broken down by medium, product and platform
Finally, revenue is broken down by product to identify best sellers
Revenue and number of orders is broken down by hour and by product

Support
All the support you need – when you need it. From 1-hour quick fix support to longer-term partnership that drives your business forward.

Consultancy
Advanced data thinking, creative ideas and the best Power Platform practices to unlock the true potential of your business data.

Training
Succeess shouldn’t be a one-off. When we train you teams user adoption surges and your Power Platform results radically improve.
![]()
![]()
![]()