The client is a head of HR who needed to analyse different characteristics of the employees to be able to report them to executive board.
Data Source
SQL database
Analysis Tool
![]() Tableau
Tableau
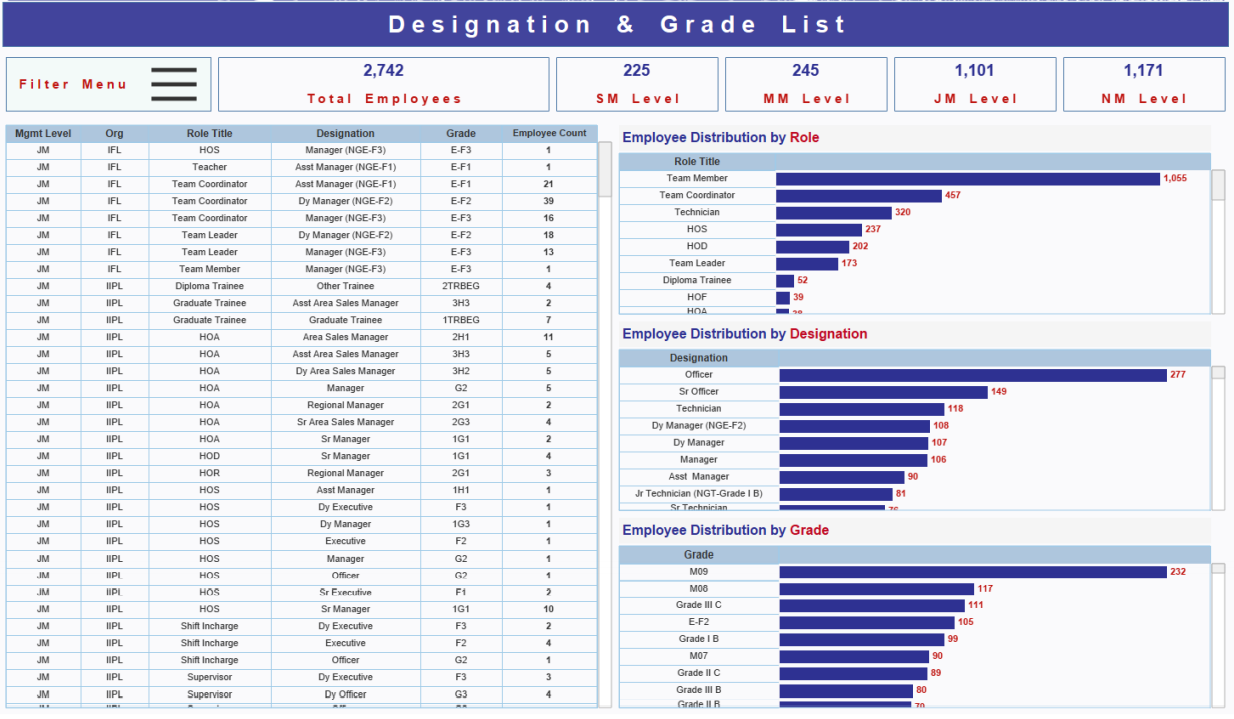
Total number of employees was analysed by role type, designation and grade.
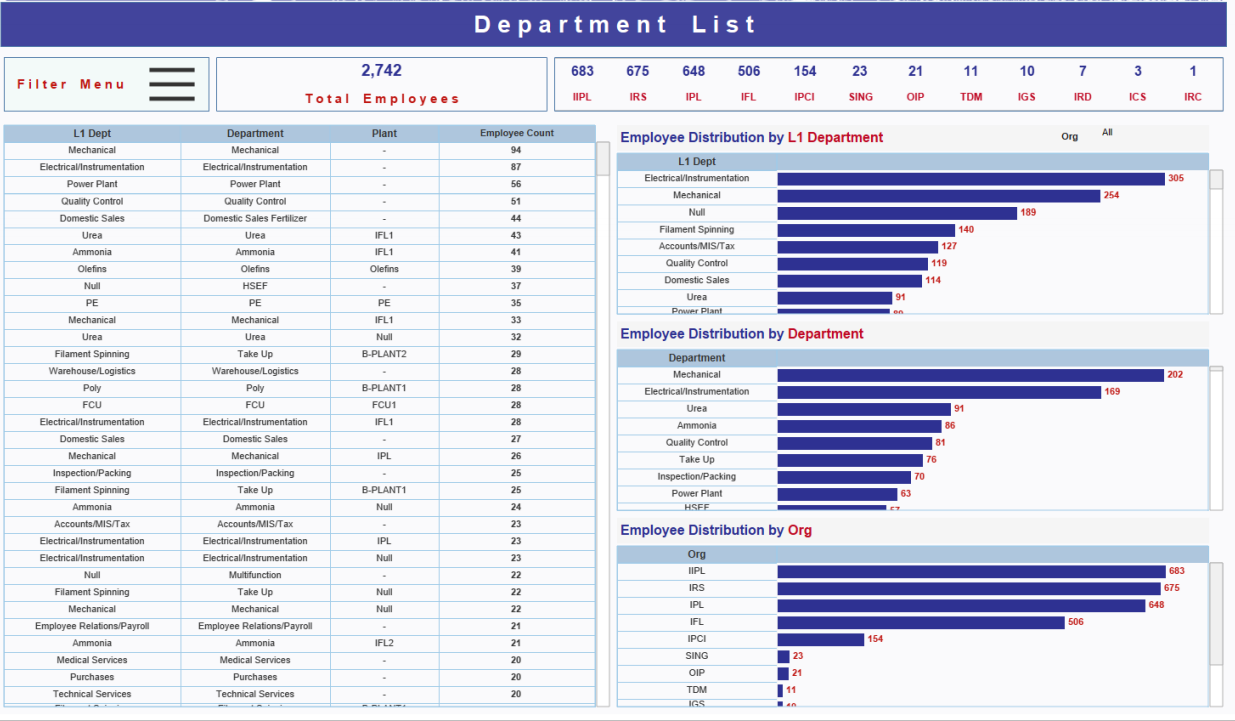
Number of employees is analysed by department and organisation
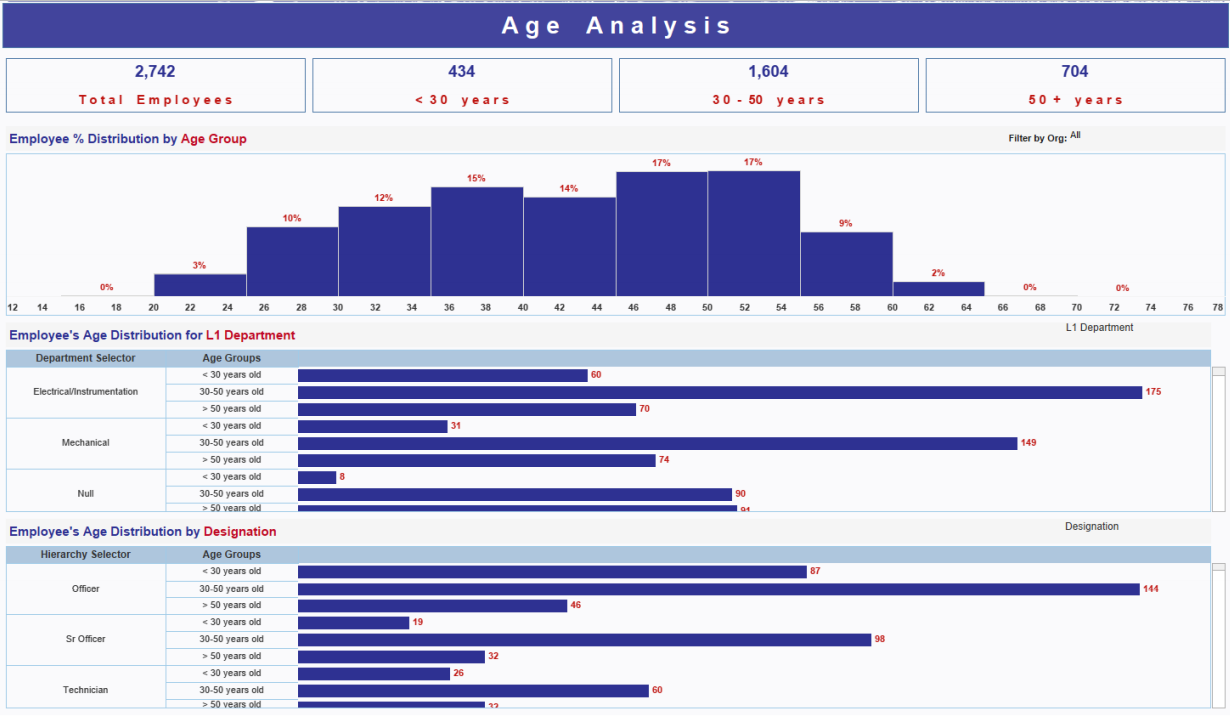
Number of employees is analysed by age group for the total company, department and designation
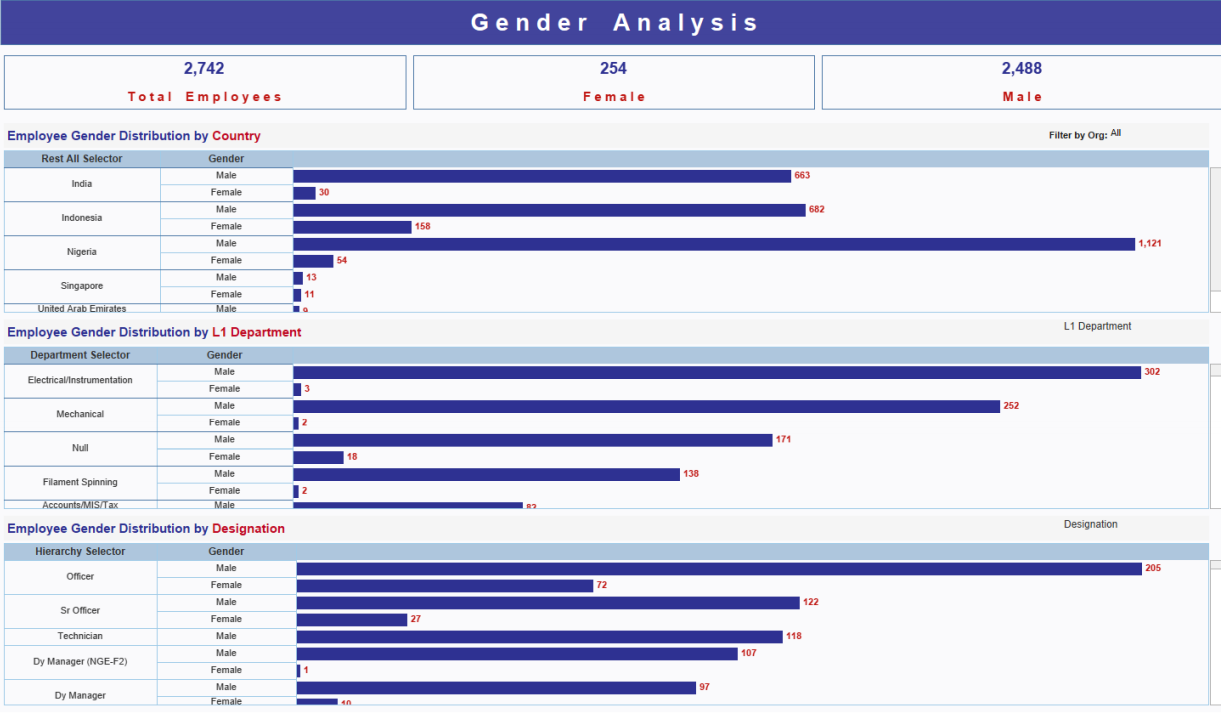
Gender distribution is analysed for the total company, for each country, department and designation
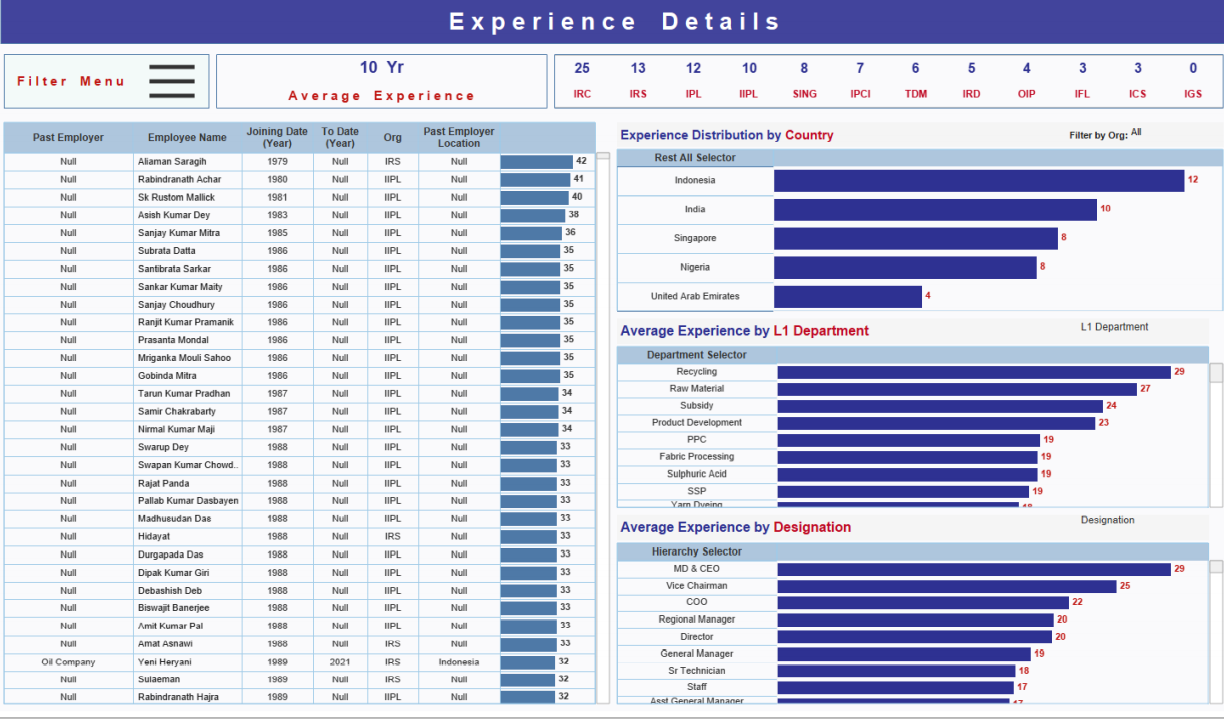
A table with employees that have most experience is created on the left. Countries, departments and designations are analysed by average years of experience for employees that work in them.

Support
All the support you need – when you need it. From 1-hour quick fix support to longer-term partnership that drives your business forward.

Consultancy
Advanced data thinking, creative ideas and the best Power Platform practices to unlock the true potential of your business data.

Training
Succeess shouldn’t be a one-off. When we train you teams user adoption surges and your Power Platform results radically improve.
![]()
![]()
![]()