Using Firebase Looker studio, we worked with a CTO of a SaaS company to produce engagement analytics report of how engaged users of the app are. The intention here is to increase engagements so that the users remain subscribed for longer.
Data Source
Firebase through Big Query
Analysis Tool
Power BI
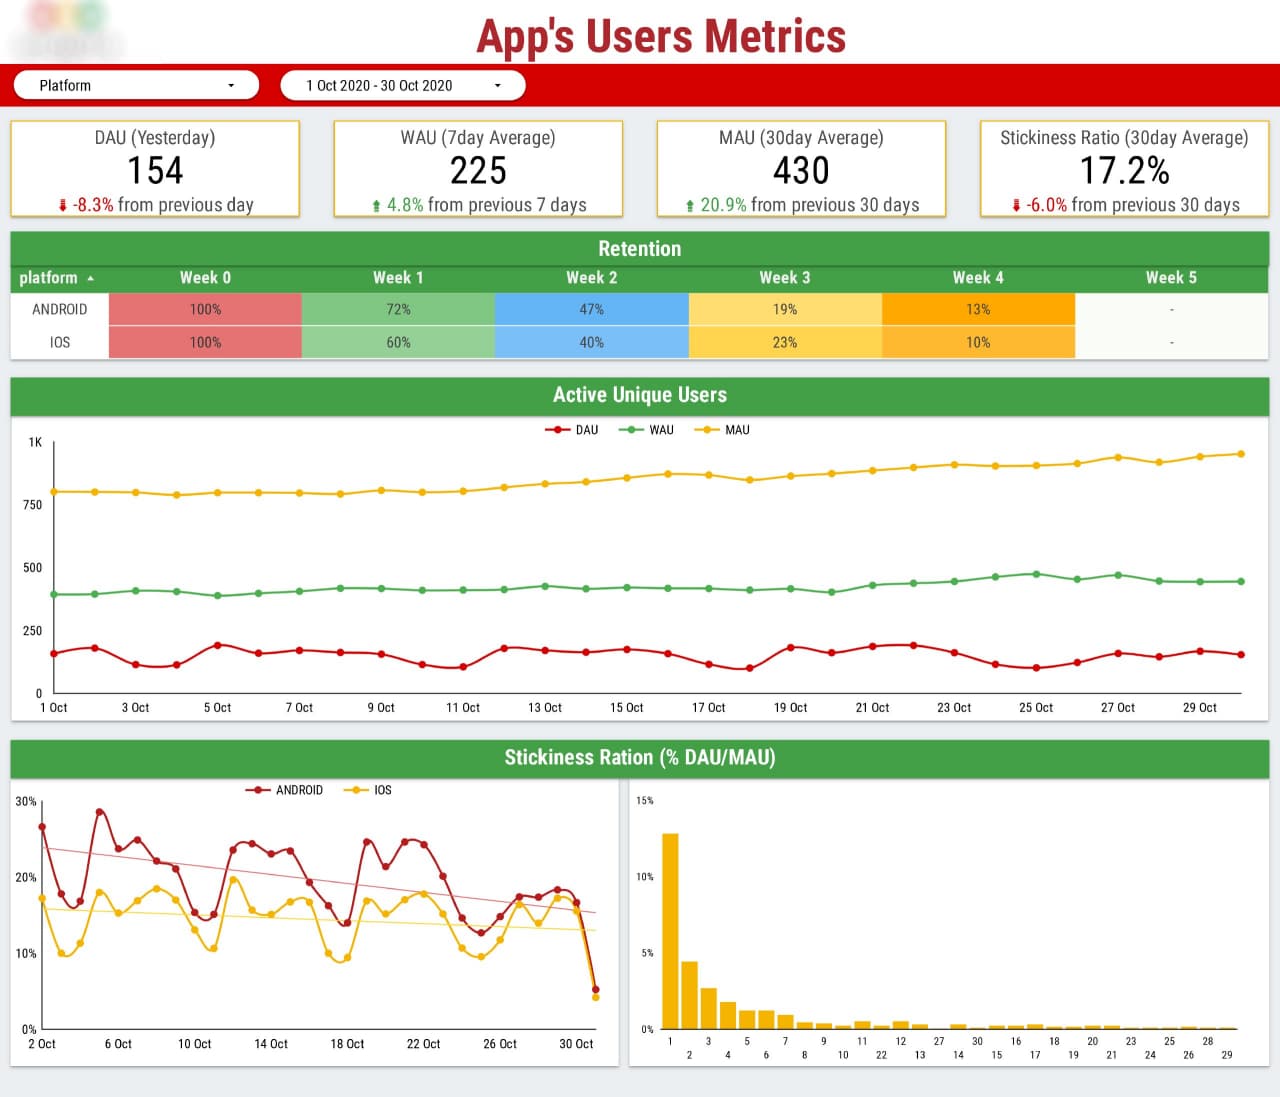
At the top we have high-level metrics such as Daily/Weekly/Monthly Active Users.
Stickiness ratio is the ratio of daily active users to monthly active users. It essentially measures how ‘sticky’ an app is. For example the ratio of 17.2% means that 17.2% of users who use the app on monthly basis also use it on daily basis. In any particular day stickiness ratio measures how many of users that day also logged in over the last 30 days.
Retention percentage is analysed to understand how many users that start using the app still use it in 1 week, 2 weeks, etc.

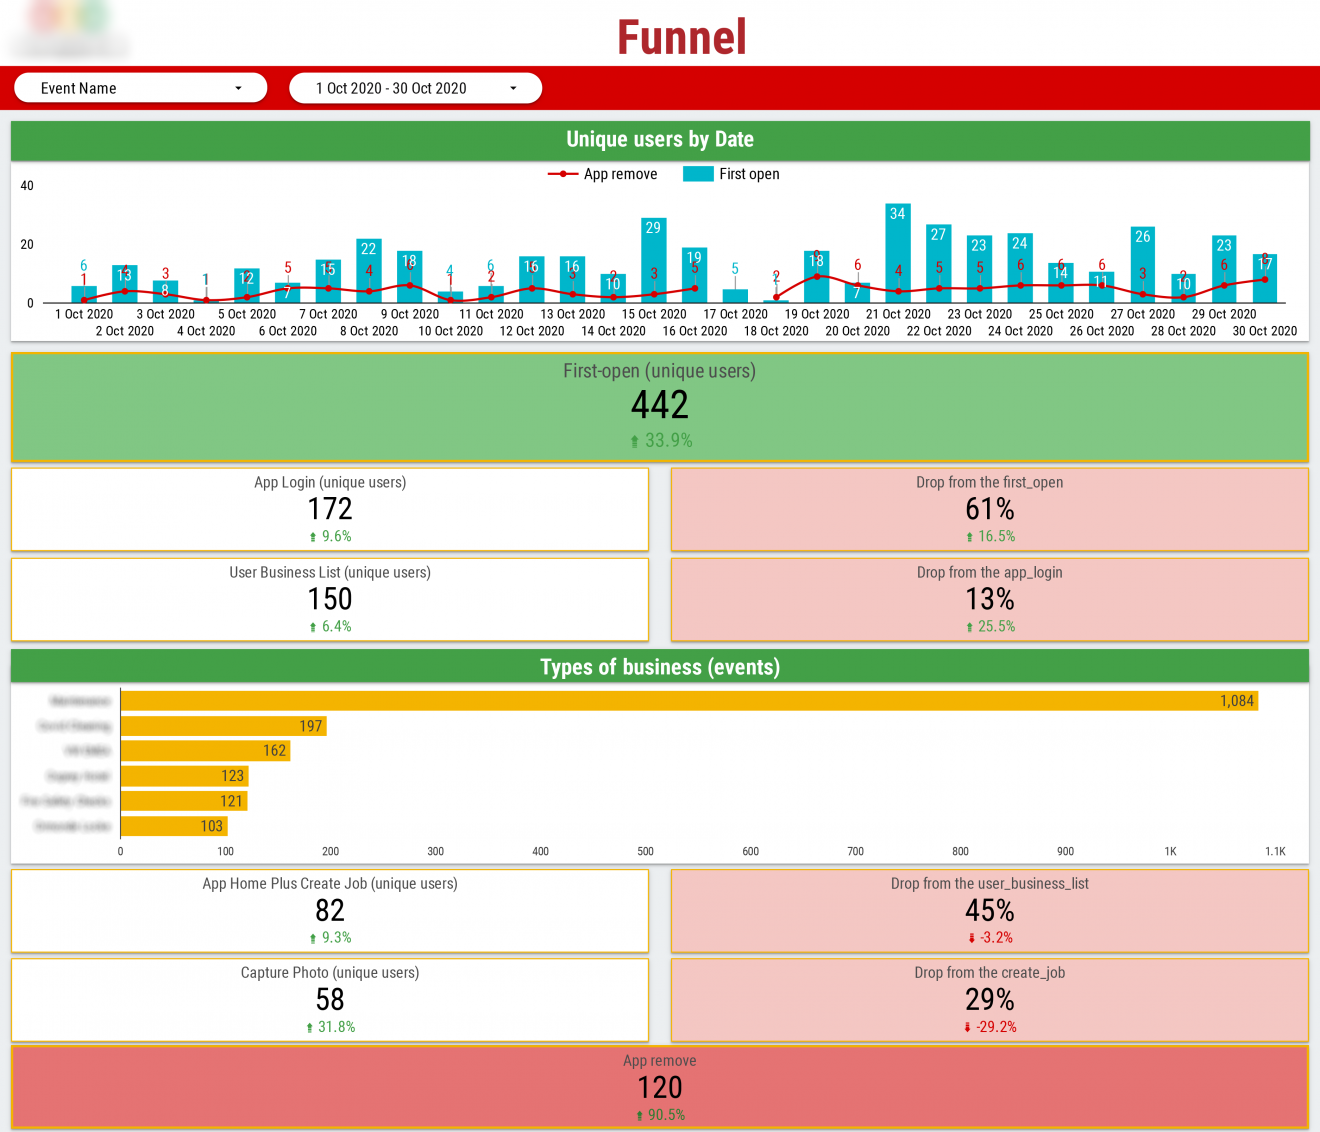
App first open and removal events are analysed as standalone numbers and trends per day.
Number of different events that contribute to the definition of an active user are also calculated such as creating a job or uploading a photo.
Types of businesses that contribute to these events are also analysed.

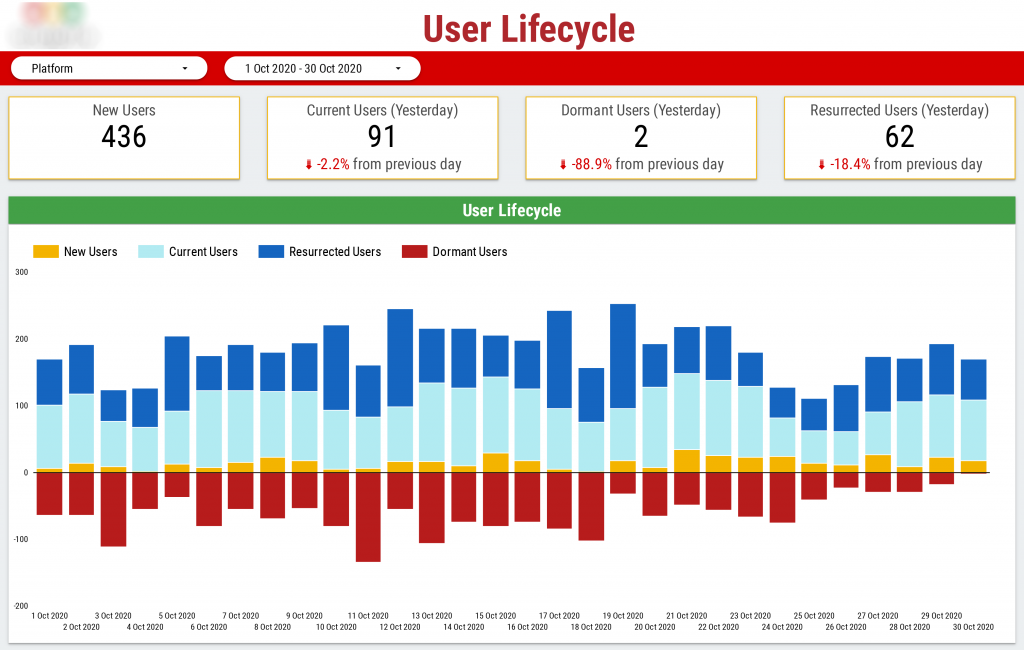
This page analyses the stage of the user lifecycle: whether they are new, active, dormant or resurrected.
The intention is to monitor that the portion of dormant users does not increase. Otherwise this means that there is an engagement problem.
Another way to use this chart is to make sure that more dormant users become resurrected.

Working directly with the CTO, we delivered a powerful Google Data Studio report, providing actionable insights into user engagement for a mobile app. We created a seamless data pipeline by integrating Firebase data with BigQuery. This pipeline is capable of handling large volumes of event data.
We developed precise formulas using SQL to calculate key performance indicators, ensuring the analysis shows insightful trends in user behaviour.
We visualised our findings through custom report in Google Data Studio, enabling stakeholders to improve app performance by monitor engagement metrics. This solution significantly enhanced the client’s ability to track and optimise user engagement strategies.
Ready to take advantage of our Firebase Looker Studio?
Support
All the support you need – when you need it. From 1-hour quick fix support to longer-term partnership that drives your business forward.
Consultancy
Advanced data thinking, creative ideas and the best Power Platform practices to unlock the true potential of your business data.
Training
Succeess shouldn’t be a one-off. When we train you teams user adoption surges and your Power Platform results radically improve.