The Financial Director of Tikkurila reached out to us in order to get help with Power BI implementation for his Sales and Finance organisation.
Data Source
Dynamics NAV database, Excel
Analysis Tool
![]() Power BI
Power BI
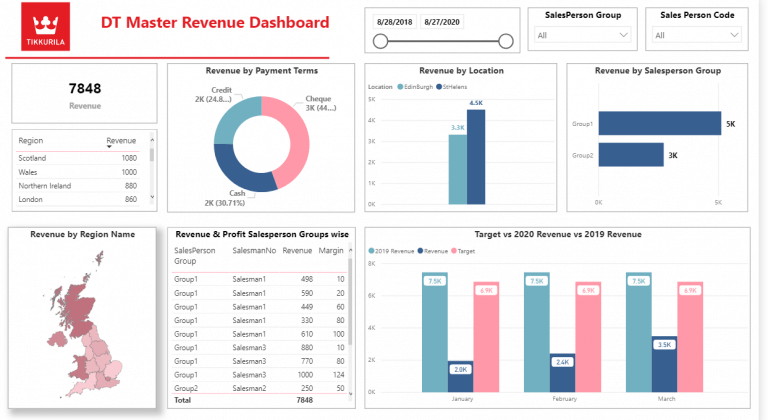
The revenue is analysed by region and presented in a heatmap so that the user can quickly compare regions to each other as well as the table so that the user can read the exact number.
Revenue and profit are broken down by salesperson, sales team and payment method.
Finally revenue for this year is broken down by month, compared to prior year and target for this year.
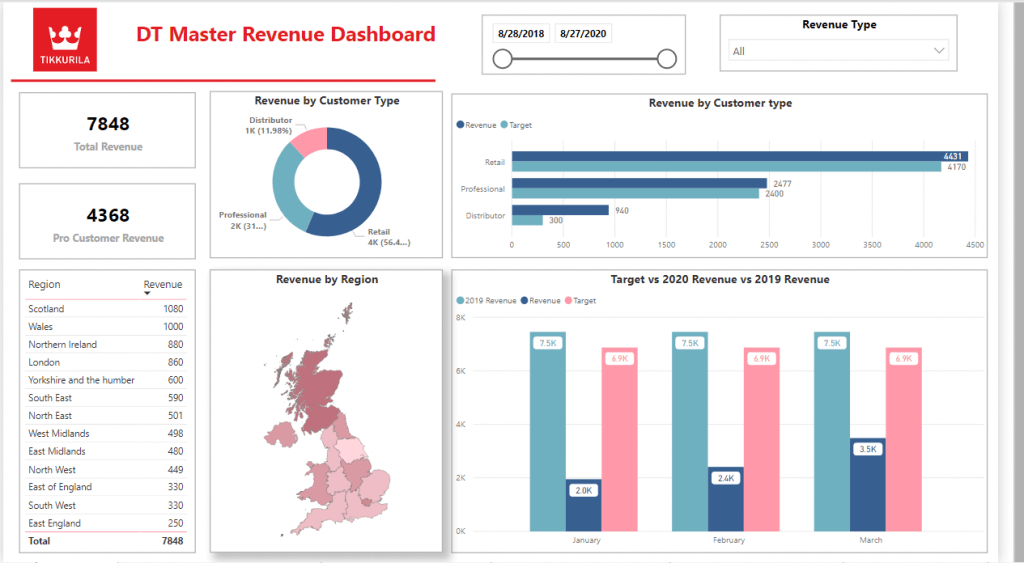
Comparing to the previous page where only direct sales organisation is analysed, this page covers all the sales channels including distributors and retail.

Support
All the support you need – when you need it. From 1-hour quick fix support to longer-term partnership that drives your business forward.

Consultancy
Advanced data thinking, creative ideas and the best Power Platform practices to unlock the true potential of your business data.

Training
Succeess shouldn’t be a one-off. When we train you teams user adoption surges and your Power Platform results radically improve.
![]()
![]()
![]()