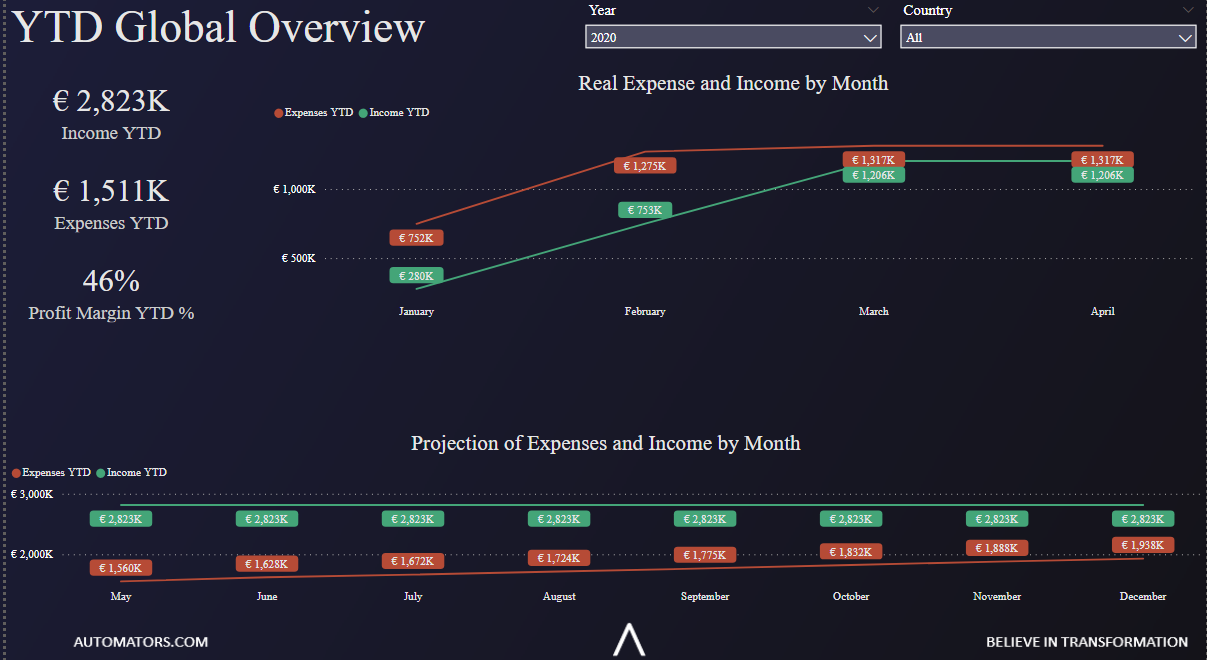
One of the Automators partners needed a report that would analyse financial health of the business. The goal was to use this report for presentation to other partners, review financial results and trends.
Please note that all data on the screenshots is randomised so no real client data is disclosed.
Data Source
MySQL and Sharepoint lists
Analysis Tool
Power BI
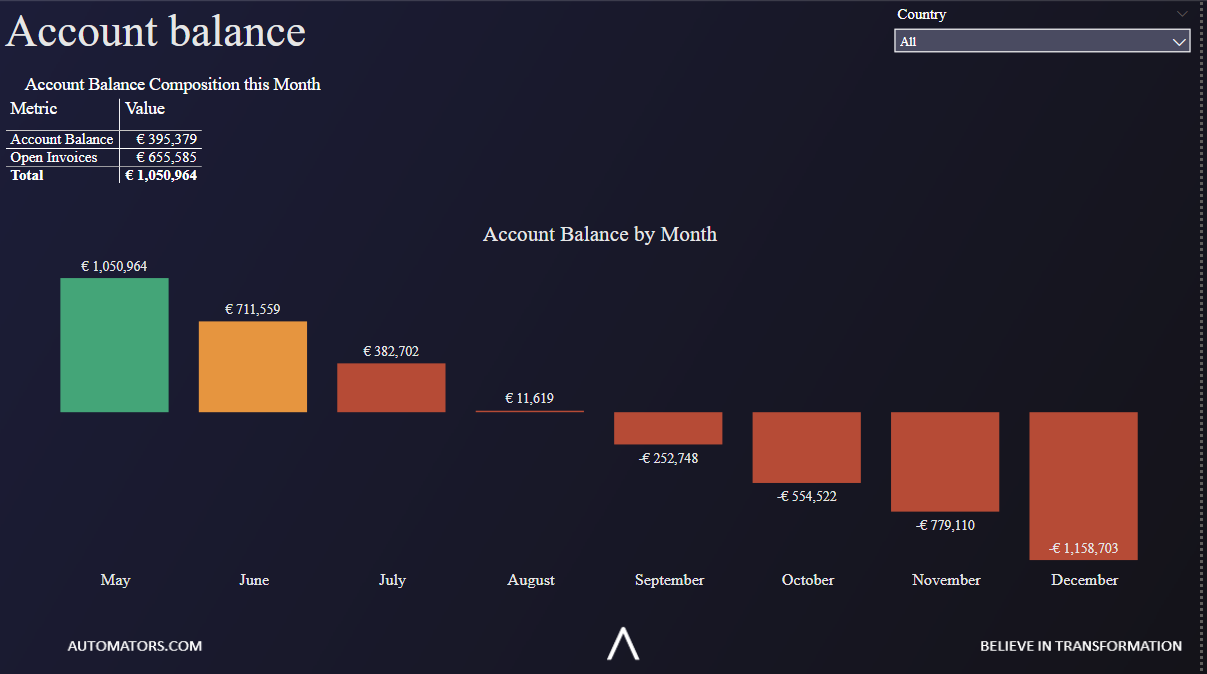
A KPI for account balance was created. This KPI takes current account balance into account and subtracts planned expenses for future months.
The visual on the right shows that in 4 months the company will be out of cash if no revenue is generated.
Green colour means that there is enough cash for more than 3 months. Orange is for when there is enough cash for next 2 months and red is for when there is only cash for 1 month or less.
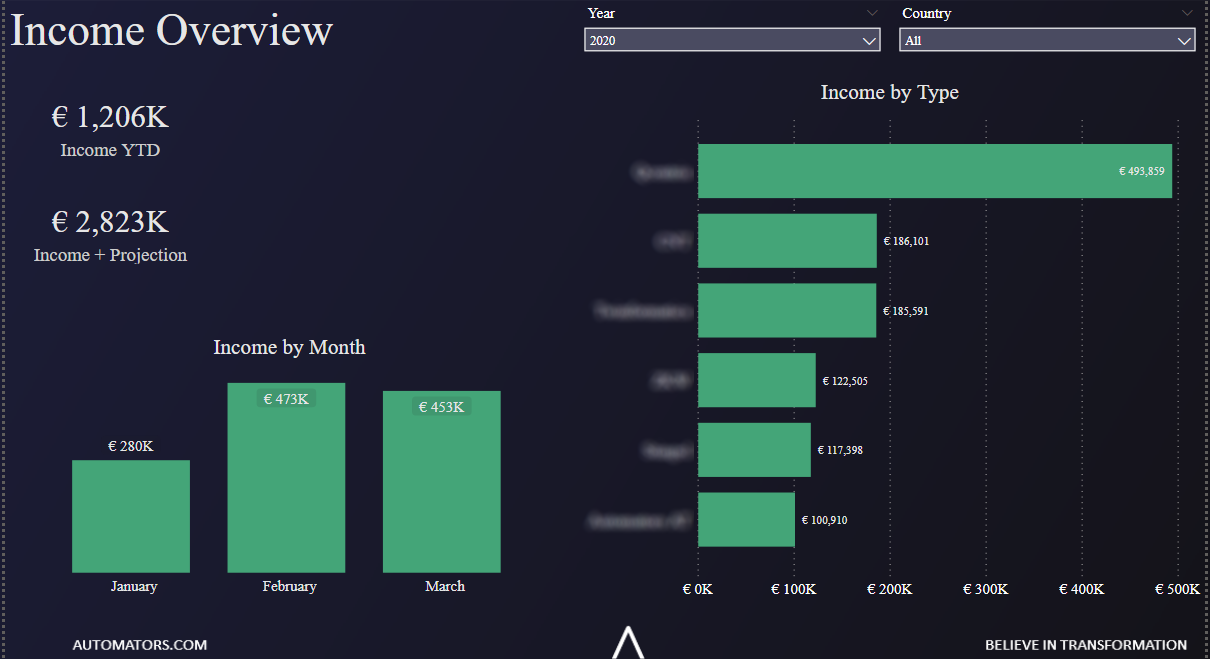
Revenue is broken down by month and client. Income YTD is shown as well as income + forecast till the end of the year. There is also an option to filter by year and country
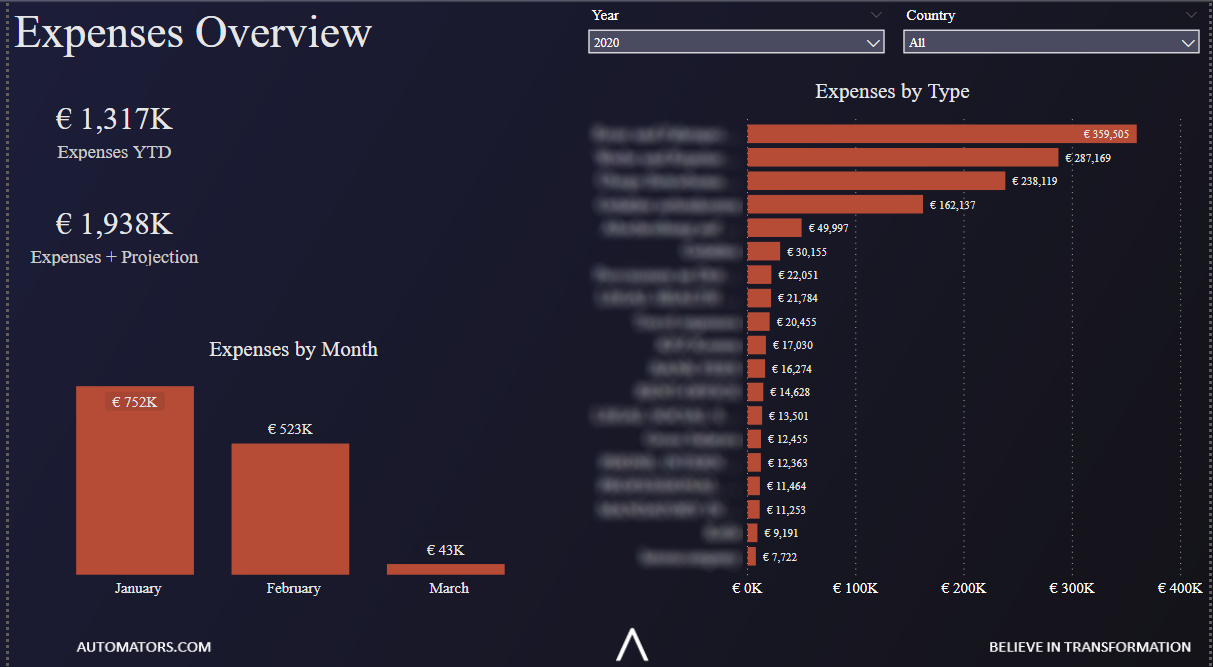
Expenses are broken down by month and type. There is also an option to filter them by year and country. Income YTD is shown as well as income + forecast till the end of the year
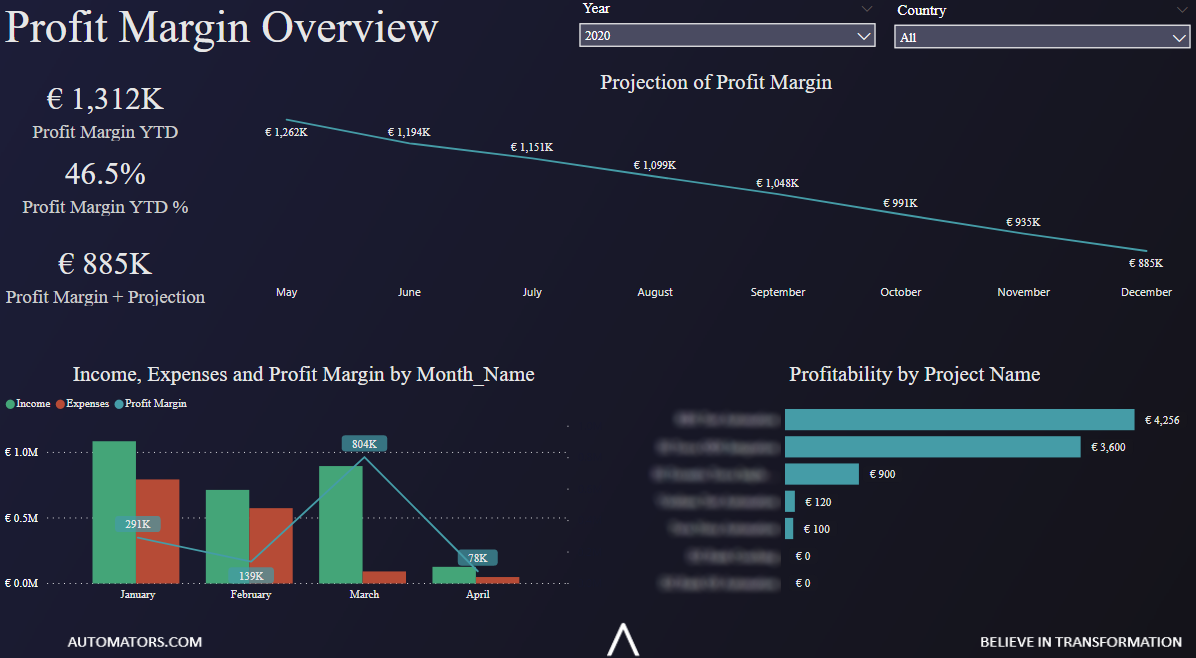
There is a projection of profit by month based on projected income and expenses. Actual income, expenses and profit are shown on the same chart. Profit is broken down by project to show the most profitable projects. Profit is shown as a real number and as percent of revenue. There is also an option to filter by year and country.
Support
All the support you need – when you need it. From 1-hour quick fix support to longer-term partnership that drives your business forward.
Consultancy
Advanced data thinking, creative ideas and the best Power Platform practices to unlock the true potential of your business data.
Training
Succeess shouldn’t be a one-off. When we train you teams user adoption surges and your Power Platform results radically improve.