The client is an e-commerce brand that have 8 Woo Commerce shops. They wanted to combine the data for all 8 shops they have and 8 data sources for every shop.
The deliverable is the dashboard which allows to simultaneously filter data for several data sources from one filter. This dashboard provides a wholistic view on the online activity of the company.
Data Source
JSON, Email, Open Exchange Rate, Woo Commerce, Big Query, Google Sheets, Google Ads, Google Analytics
Analysis Tool
![]() DOMO
DOMO
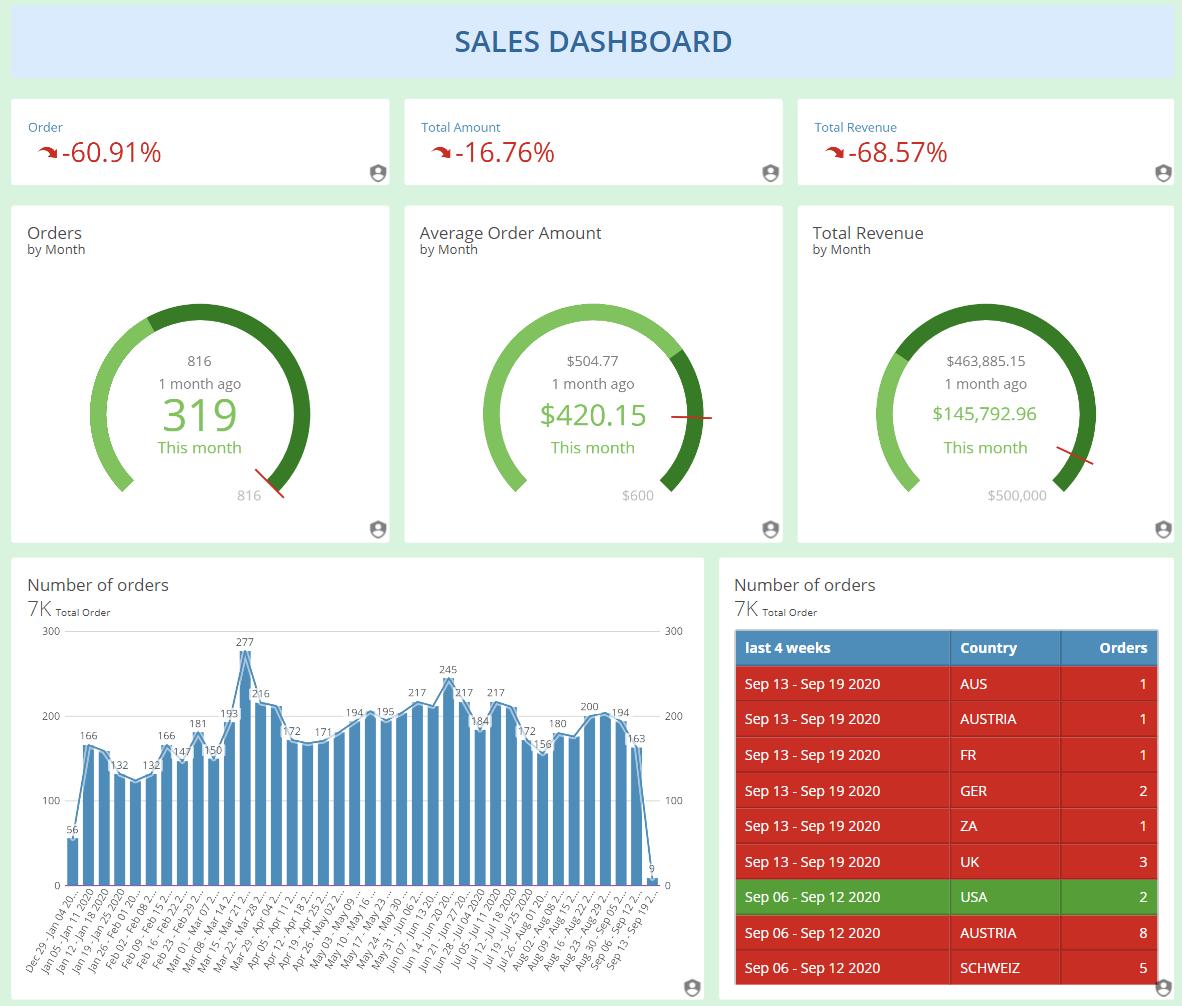
This area of dashboard analyses number of orders, AOV and total revenue. These metrics are compared to last month and monthly target.
Number of orders is broken down by week. In addition. there is a table that breaks down number of orders by country and by week. It the target is met then the row is formatted in green, otherwise it is coloured in red.
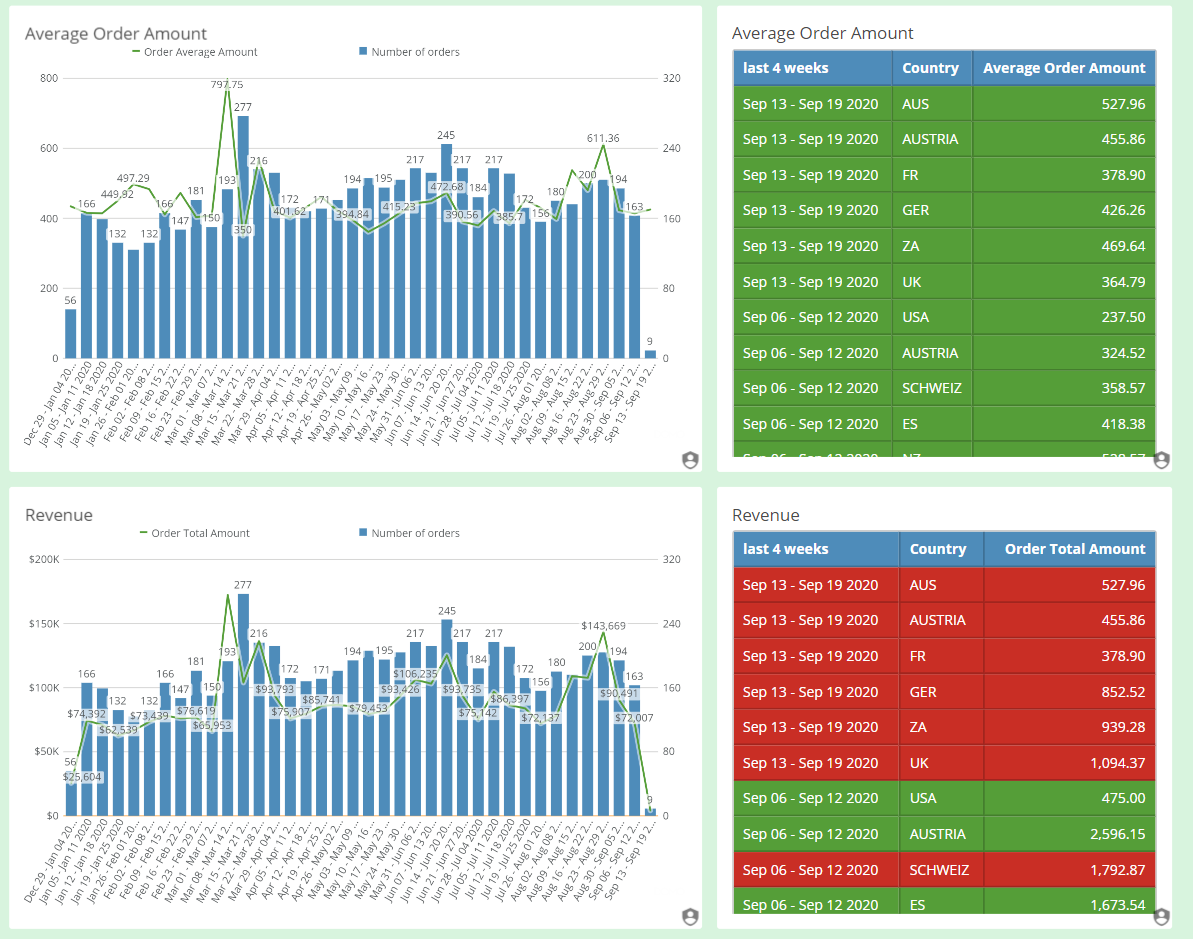
Revenue and AOV are also broken down by week and country the same way as on the screenshot above.
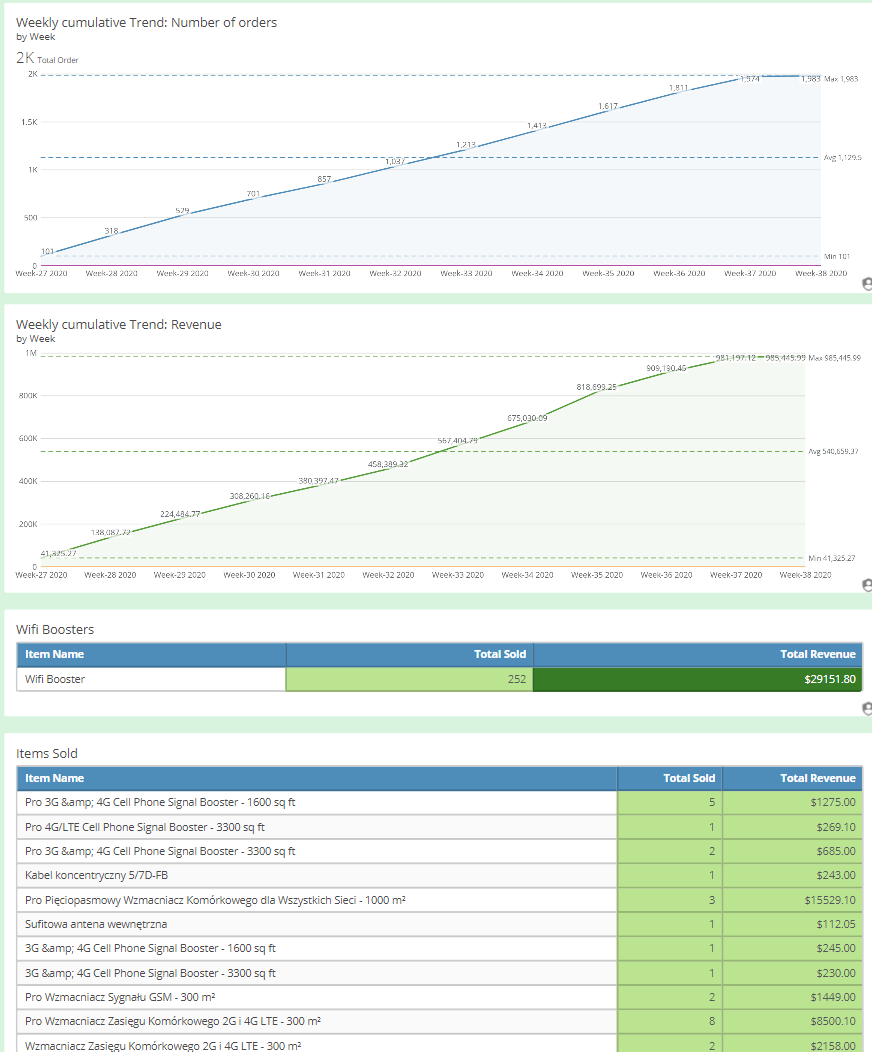
The same metrics are also shown as a running total broken down by week.
Revenue and number of items sold are also broken down by SKU name.
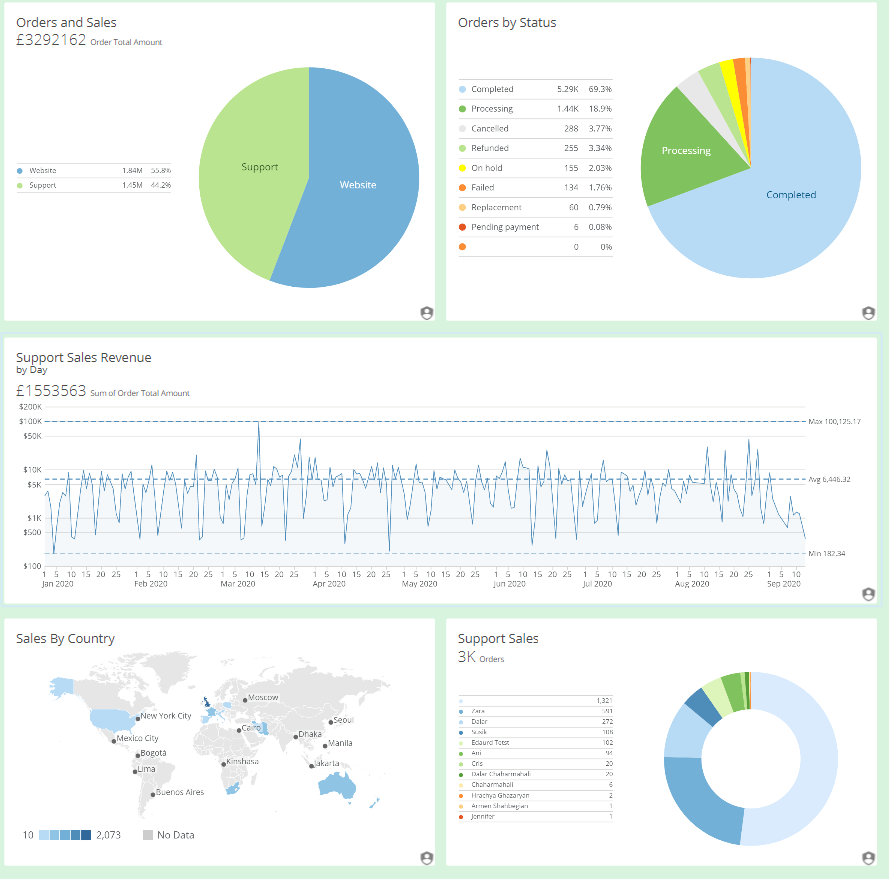
The sales numbers are broken down by sales channel. The current orders are also broken down by order status.
Support sales are then broken down by date, country and salesman.
The number of new and returning customers is broken down by week.
Total sales calls are broken down by day and answered/not answered calls.
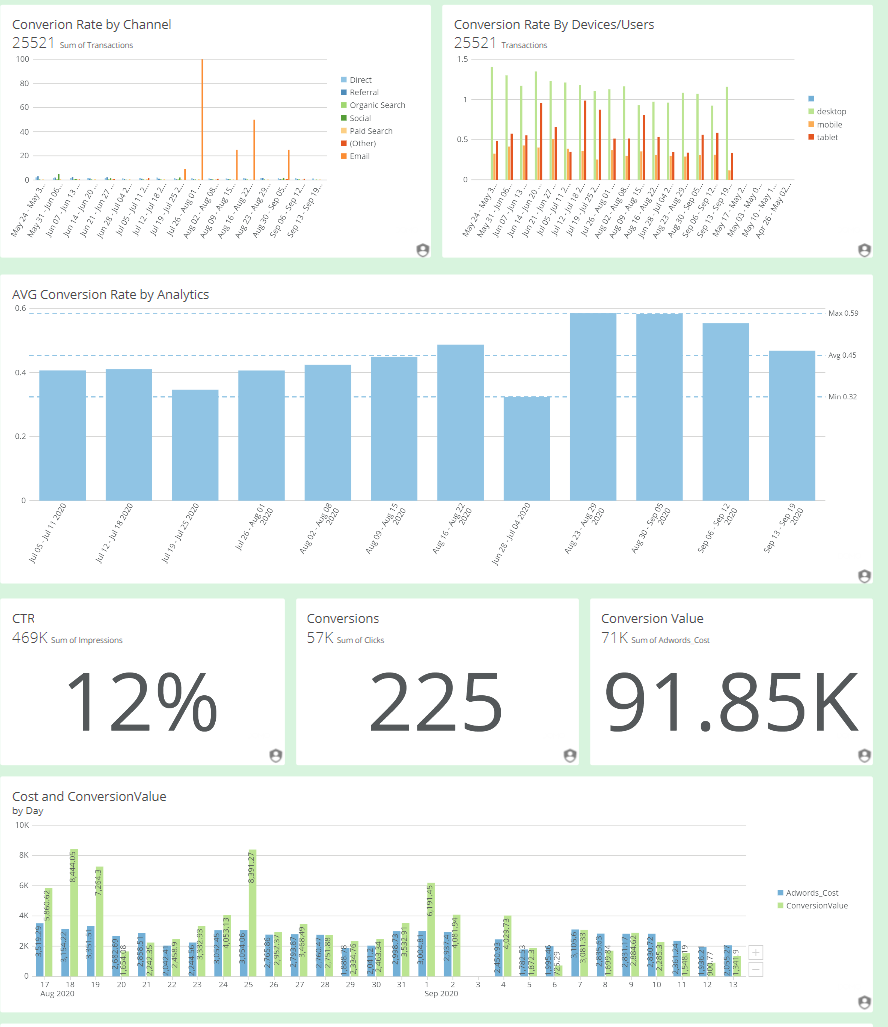
This section analyses the data from Google Analytics and Google Ads. Trafic is broken down by week
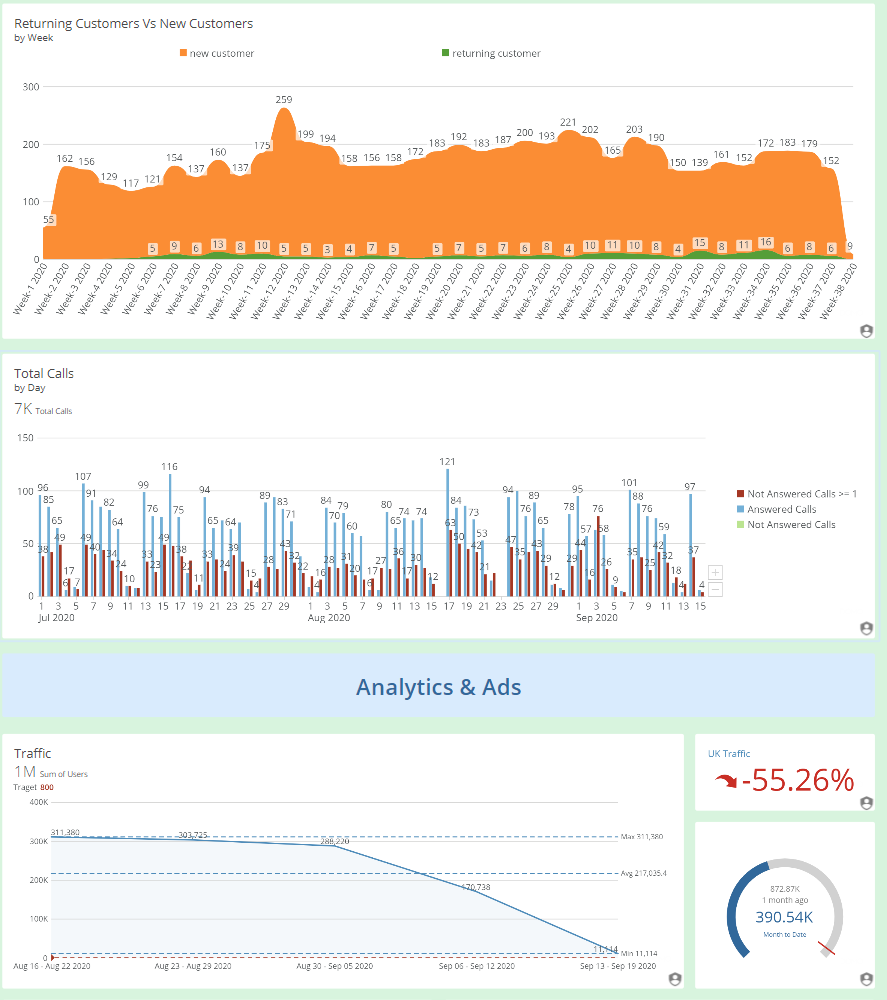
Conversions are analysed by channel and device. Average conversion rate is also broken down by week and shown as a progression.
CTR, conversion and conversion value are shown in cards.
There is also a graph that shows the Google Ads cost by day and compares it to revenue generated from ads.
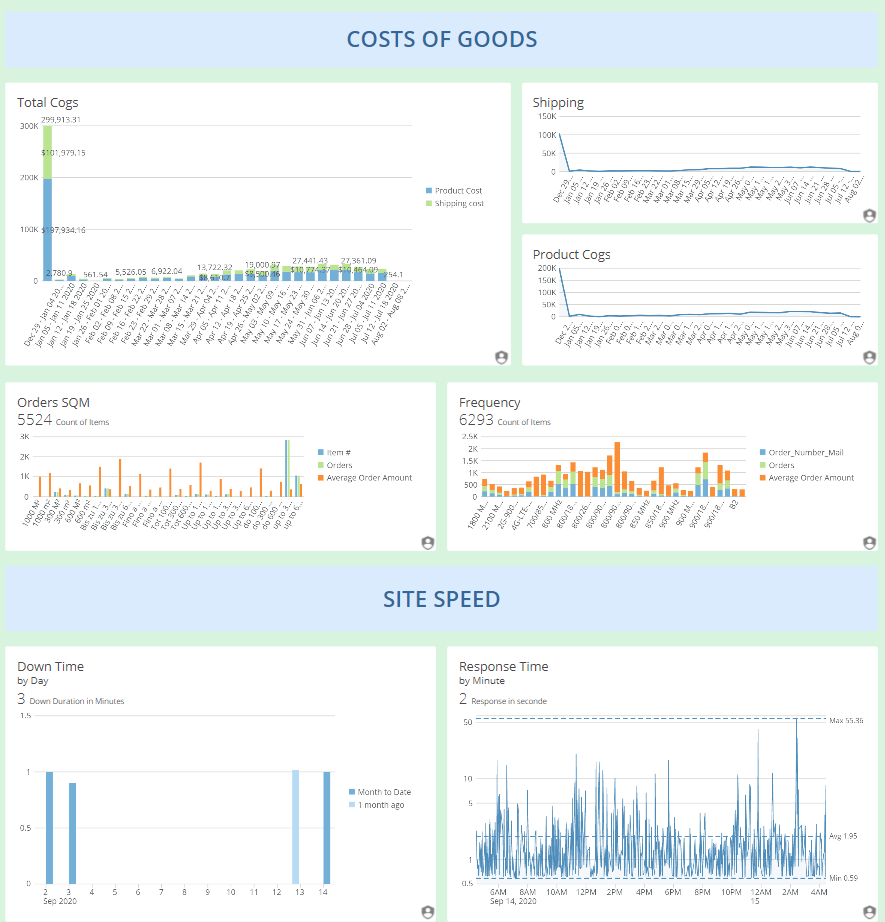
Product cost and shipping cost is broken down by week on the same graph, There are 2 more line charts that show product cost and shipping costs separately.
As this client is selling boosters, the graphs below show number of boosters and AOV by its range of coverage. The graph next to it shows the same metrics broken down by frequency of boosters.
Finally, site speed is analysed by day and time of day.

Support
All the support you need – when you need it. From 1-hour quick fix support to longer-term partnership that drives your business forward.

Consultancy
Advanced data thinking, creative ideas and the best Power Platform practices to unlock the true potential of your business data.

Training
Succeess shouldn’t be a one-off. When we train you teams user adoption surges and your Power Platform results radically improve.
![]()
![]()
![]()