This Power BI dashboard was prepared by Vidi Corp as part of the tender application for a Power BI consulting project with Buffalo Public Schools. Because of that dummy data was used to build this dashboard and no confidential data is exposed in the screenshots below. Even though this project is using dummy data, it is still one of the best work samples that we have produced.
Buffalo Public Schools released a 5 year strategic plan which highlighted a range of KPIs in different areas of their operations including academic excellence, future opportunities, helping minority demographic groups to catch up with the rest, reducing absences and suspensions, etc.
Vidi Corp found the 5 year strategic plan online and took screenshots of the KPIs that Buffalo Public Schools decided to measure. Those screenshots were placed next to the visuals to help explain to the users what insights are communicated through every graph.
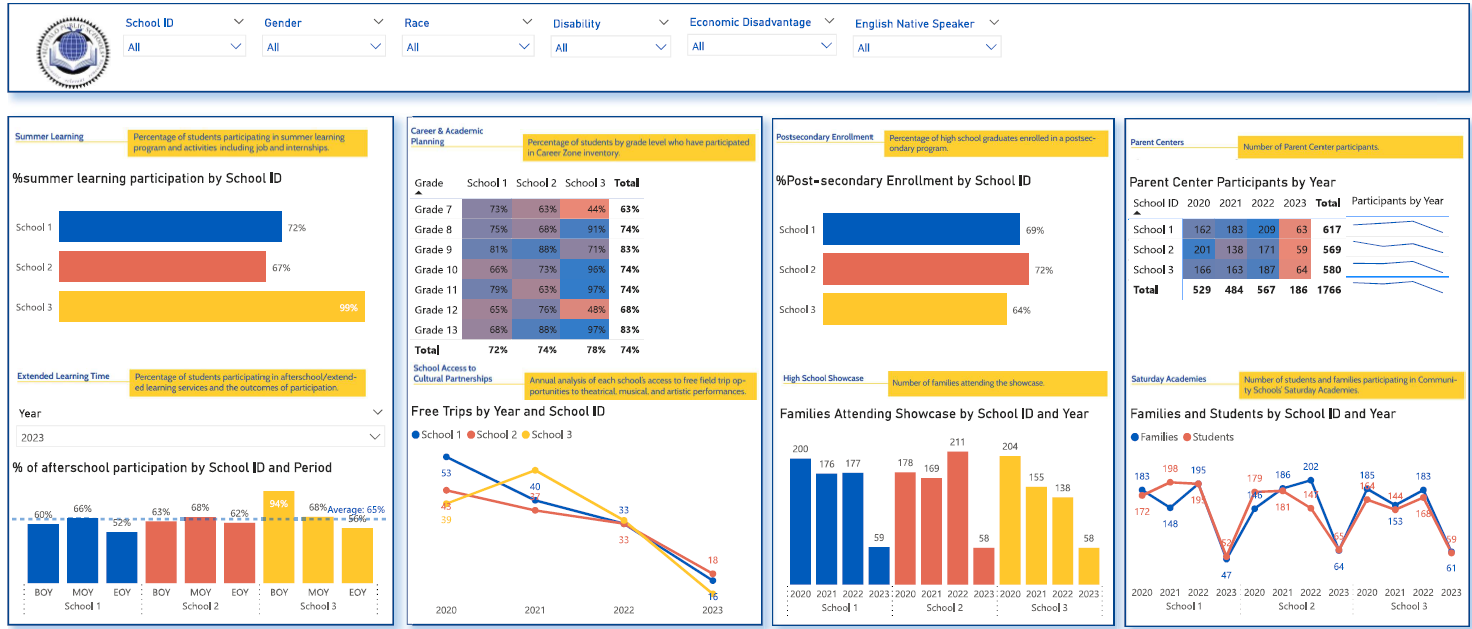
The first page was designed to measure extra-curricular activities for the students and their family participation in those activities. The filters for protected characteristics such as age, gender, disability and economic disadvantage were created so that the groups that require most support could be identified.
Some KPIs were presented for Beginning of Year (BOY), Middle of Year (MOY) and End of Year (EOY) so that the users can see how the performance changed throughout the year.
The next page of this Power BI dashboard analyzes the completion rate of exit surveys from the schools and tracks reasons for leaving. % of students who receive at least one of their school choices is also broken down by school to enable comparison of different schools in the district.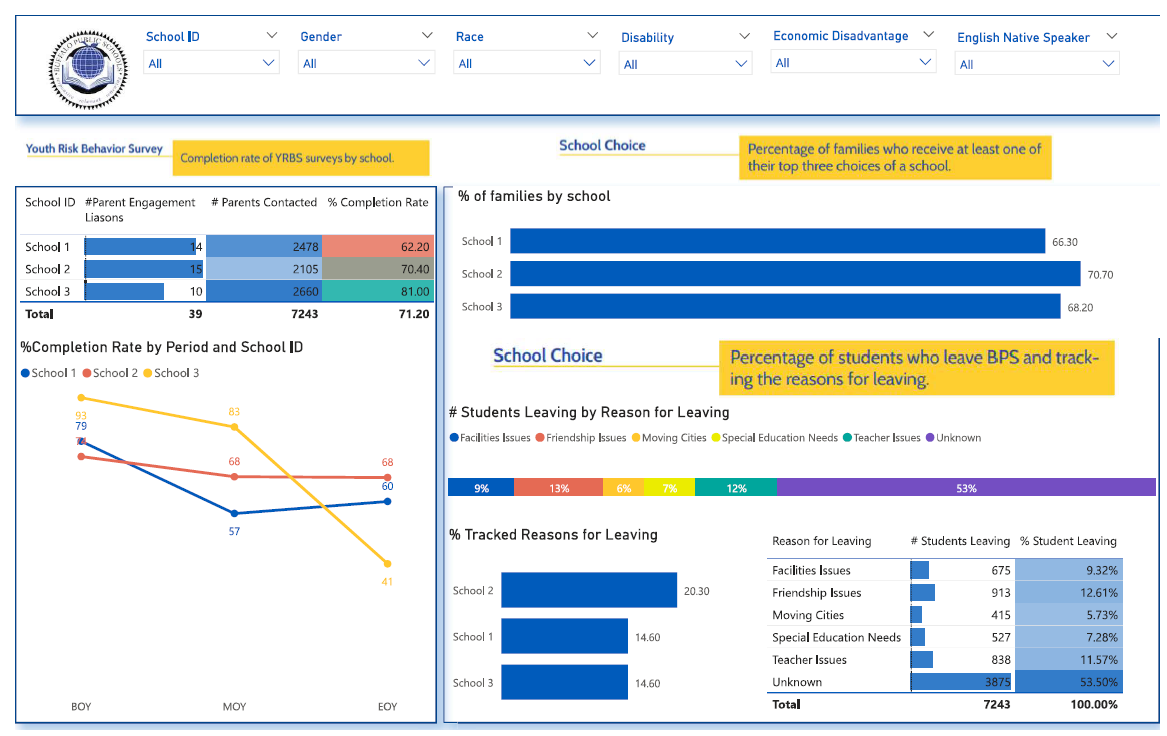
The academic performance tab measures the performance of students in the literacy and math tests. Absenteeism and special education needs are also analysed by school in the following tab.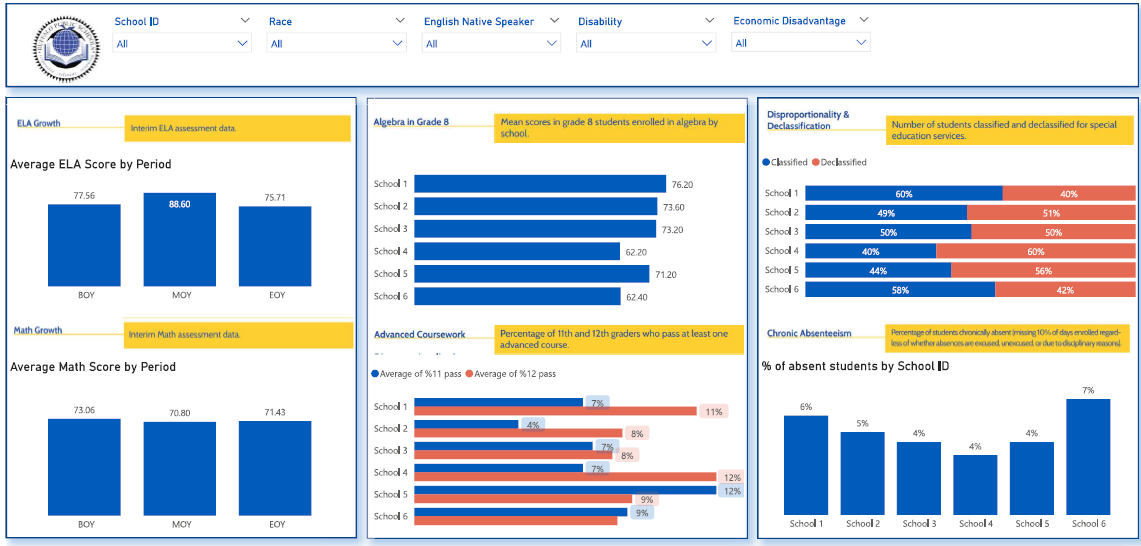
The acceptance tab measures acceptance rates of students into IB and G/T programs. 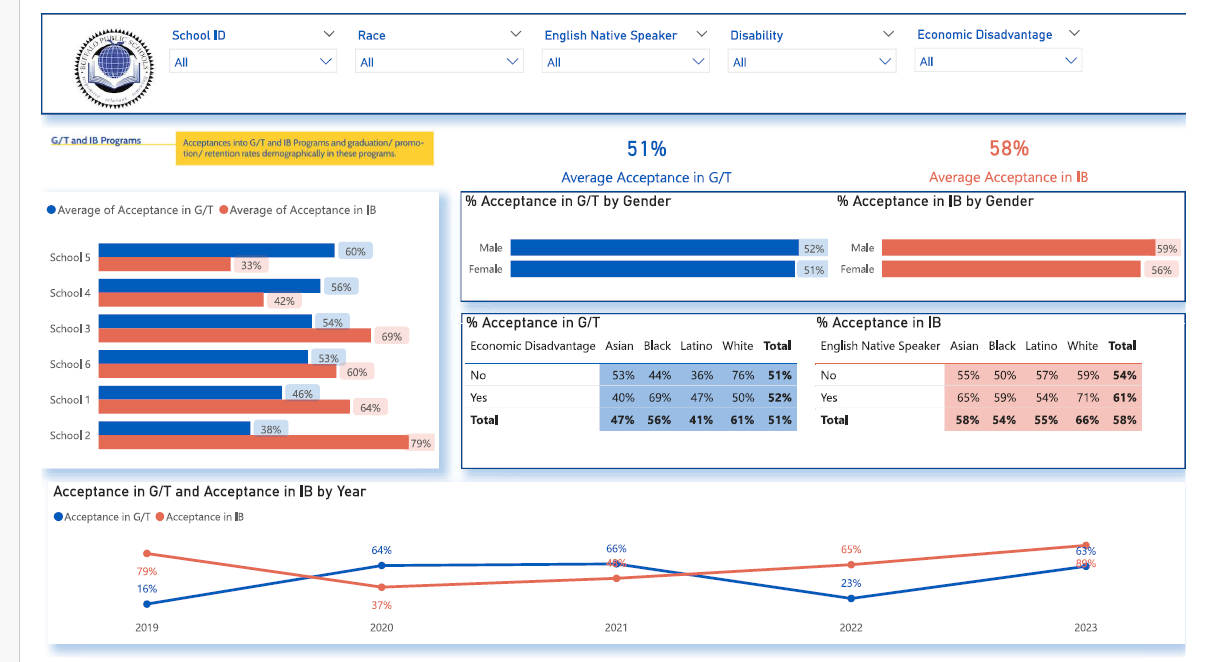
The early literacy test performance is analysed in the following tab. The number of students by grade bucket (60-100) and subject is also analysed below. The comments in green highlight the interactive features of the dashboard. 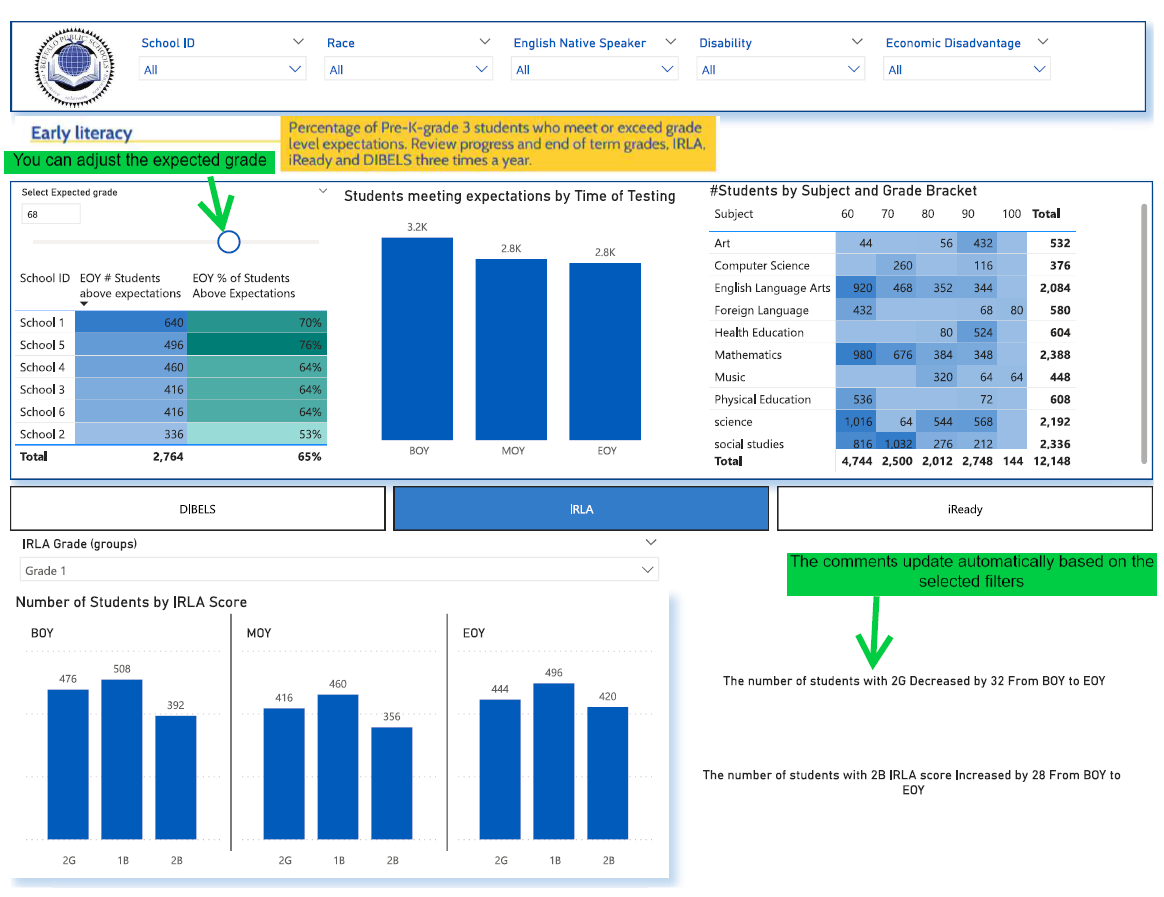
The final tab of this measures suspension and new hire diversity. The goals were to minimise suspensions by identifying the groups of students with highest suspension %. The new hire strategy is to hire the candidates from backgrounds that best reflect the demographic split of the school.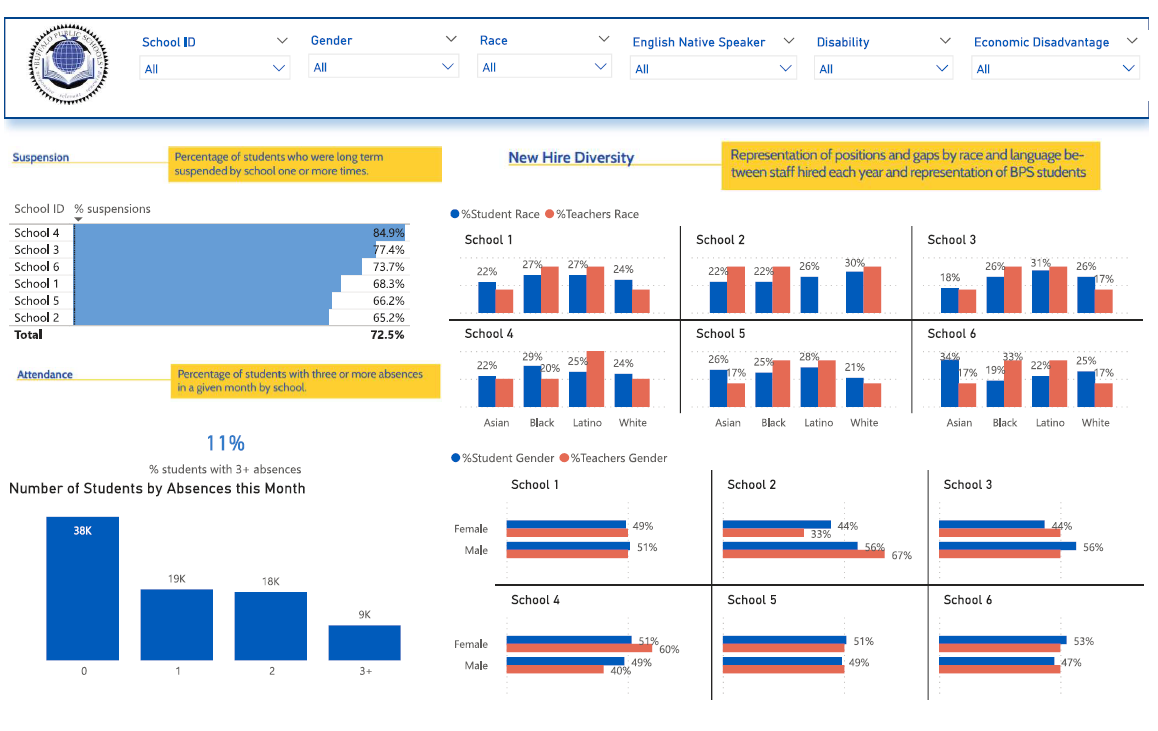
Are you working planning a Power BI for schools or universities? Contact us now to learn more about our approach for data analysis for education institutions.

Support
All the support you need – when you need it. From 1-hour quick fix support to longer-term partnership that drives your business forward.

Consultancy
Advanced data thinking, creative ideas and the best Power Platform practices to unlock the true potential of your business data.

Training
Succeess shouldn’t be a one-off. When we train you teams user adoption surges and your Power Platform results radically improve.
![]()
![]()
![]()