The client is a SaaS company in the UK targeting GPs. Their CEO wanted to answer several questions about the user-base of their app. This included:
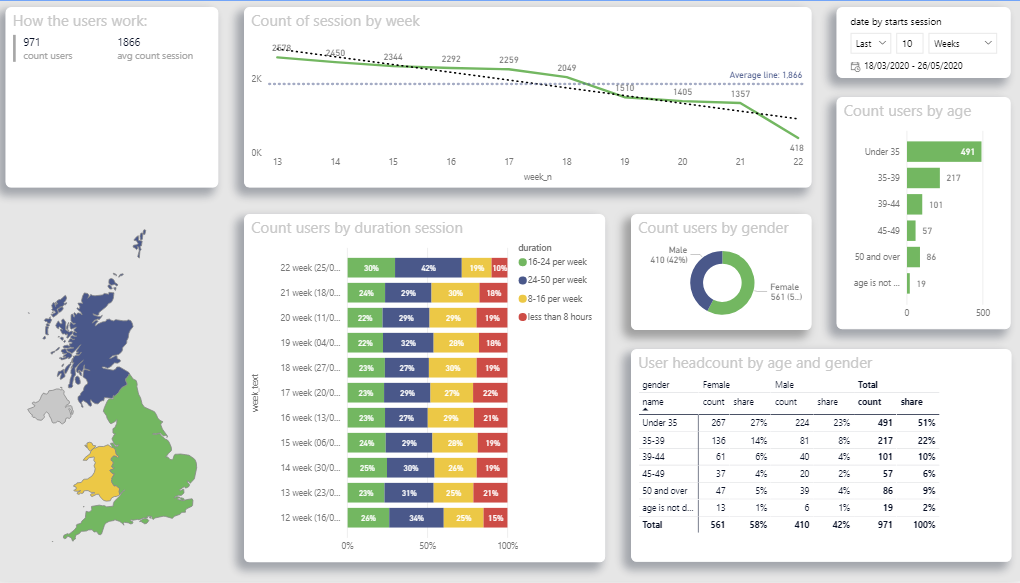
– Distribution of users by age and gender
– How many hours GPs work per week
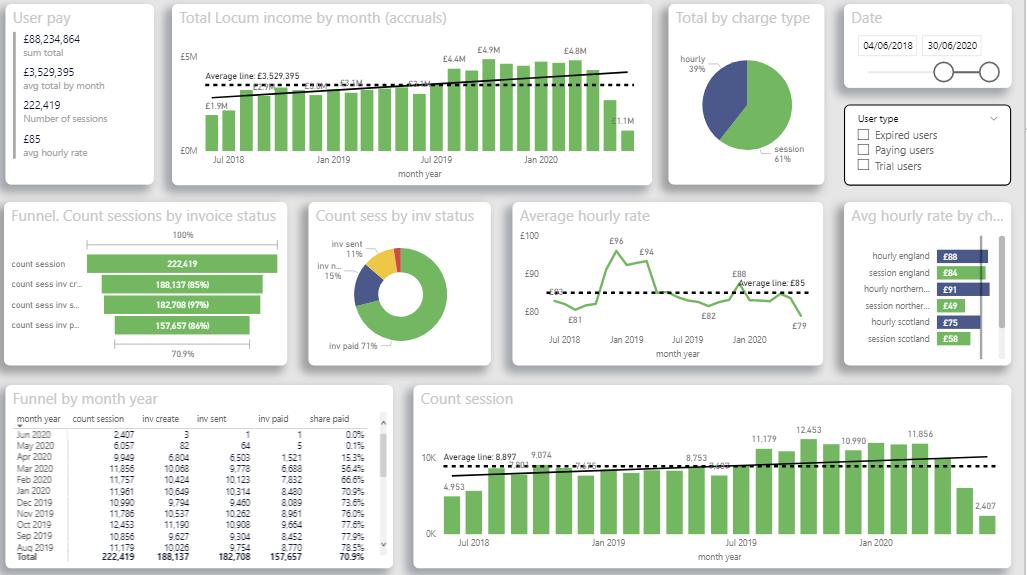
– How much do GPs charge per hour
– How many sessions on average GPs have per month
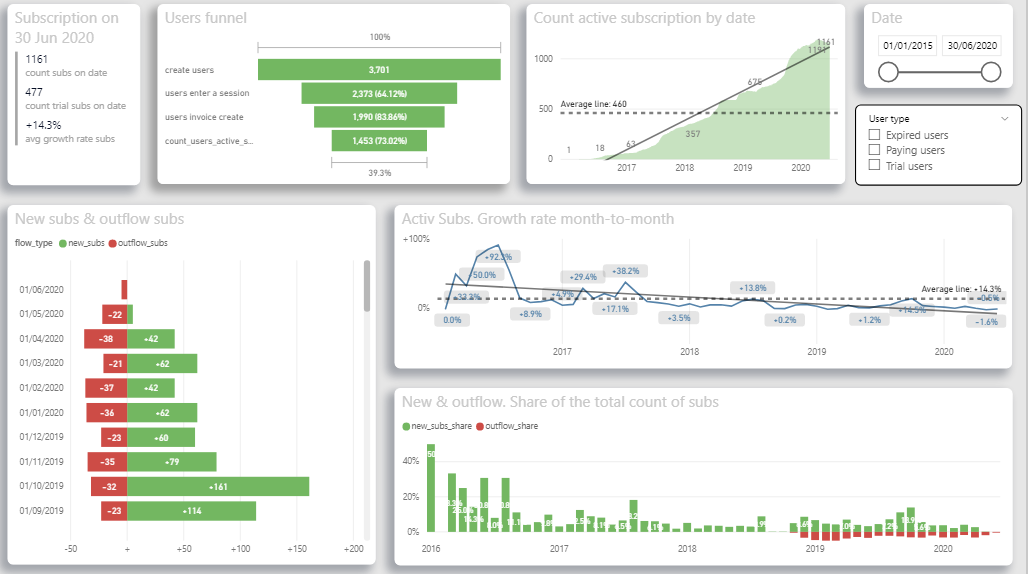
– How many active subscriptions the app has
– What is average conversion rate from free trial to paid subscription
Data Source
mySQL database
Analysis Tool
![]() Power BI
Power BI
This page is showing breakdown of users per age and gender. Users are analysed by amount of hours they work every week. Total number of sessions booked through the app is also broken down by week.
Conversions for users than enter on free trial are analysed on every step of the funnel: creating their user, creating a session, creating an invoice and paying for a subscription.
The growth trend for active subscriptions in analysed. There is also a separate visual to see how many subscriptions expire and get join every day.
There is an option to fitter by date range and user type
This page analyses earning patterns for the users of the app. There is an analysis of whether users charge per hour or per session, their hourly rate, count of sessions they book per month. All the metrics can be filtered by date and user type.

Support
All the support you need – when you need it. From 1-hour quick fix support to longer-term partnership that drives your business forward.

Consultancy
Advanced data thinking, creative ideas and the best Power Platform practices to unlock the true potential of your business data.

Training
Succeess shouldn’t be a one-off. When we train you teams user adoption surges and your Power Platform results radically improve.
![]()
![]()
![]()