This is a Power BI Survey analysis we did for a client , a market research company selling research to clients in insurance industry. They used to run weekly surveys on the impact of covid-19 on insurance customers. The results of these surveys was analysed and manually put in a PowerPoint presentation. It used to take them a lot of time to create such PowerPoint files and maintain them afterwards.
We created several 50-page Power BI reports for them that are easily refreshed and can be exported to PowerPoint or PDF.
Data Source
CSV files
Analysis Tool
Power BI
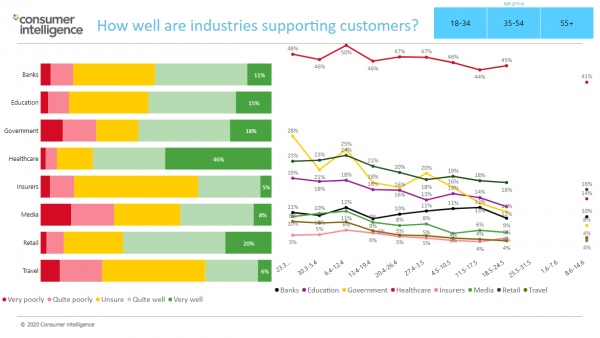
This slide breaks down the number of respondents by industry and level of respondent satisfaction with how well the industries are supporting them.
There is also a line chart showing percentage of respondents who think that their industry has been supporting them well broken down by week.
There is also an option to filter graphs by age group.

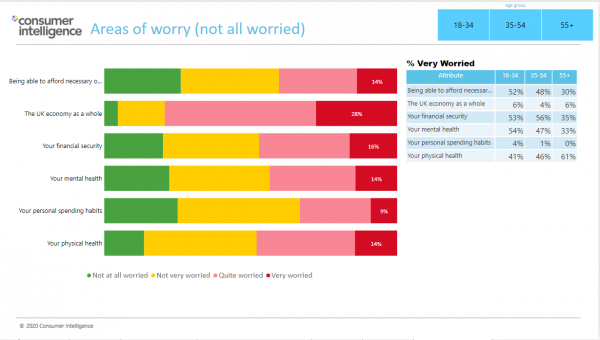
This slide shows the degree of worry of respondents about certain areas and their proportion of a total.
The table on the right shows % of very worried respondents broken down by age group and area of worry.
There is also an option to filter all data by age group.

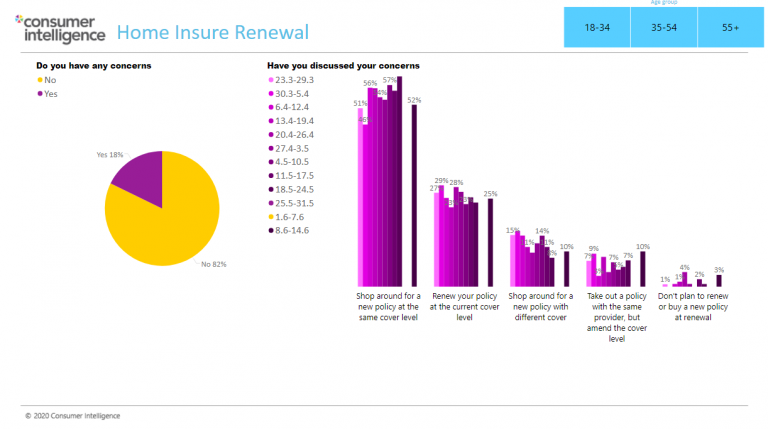
This slide breaks down the respondents to those that have a concern about their home insurer policy and those who don’t.
The intention of respondents for the future is also analysed in the line chart and broken down by week.
There is an option to filter these graphs by age group.

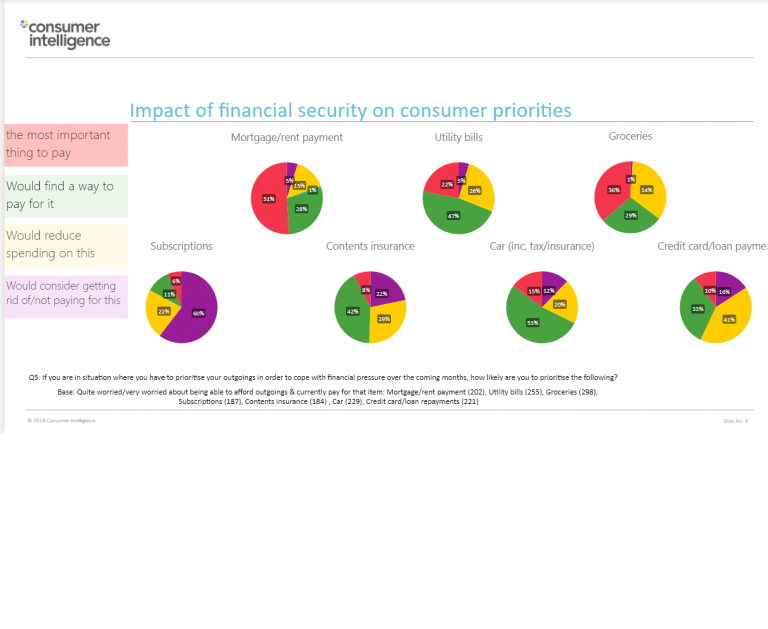
This slide breaks down what priority the respondents give to a certain area of their spending.

Do you need a detailed Power BI Survey analysis like the one above?
Support
All the support you need – when you need it. From 1-hour quick fix support to longer-term partnership that drives your business forward.
Consultancy
Advanced data thinking, creative ideas and the best Power Platform practices to unlock the true potential of your business data.
Training
Succeess shouldn’t be a one-off. When we train you teams user adoption surges and your Power Platform results radically improve.