The client wanted a sample accounting dashboard in Power BI that she could show to her management in to demonstrate the capabilities of Power BI. This dashboard was created using a dummy dataset with focus on data visualisation and integrating key insights from accounting software.
Data Source
Excel
Analysis Tool
![]() Power BI
Power BI
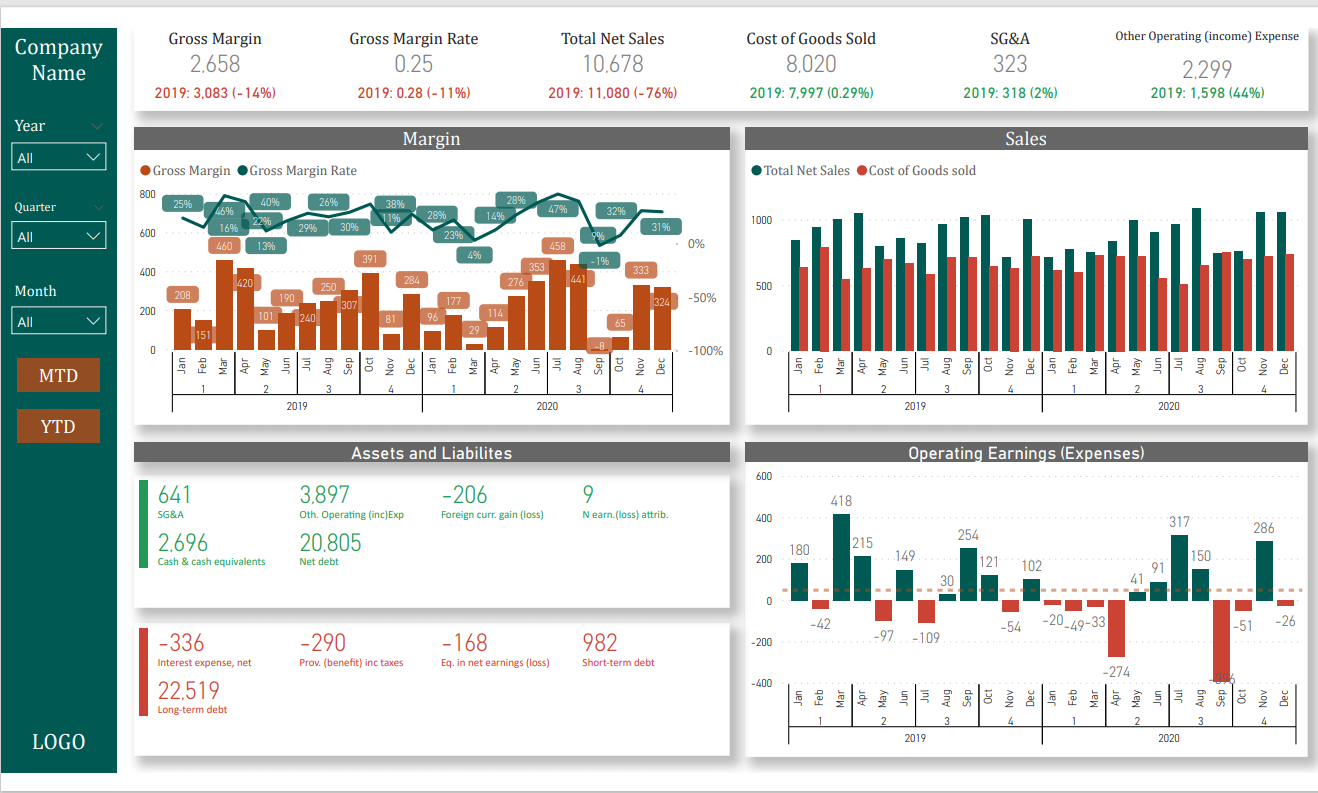
Our Power BI Consultants created the dashboard to show the key accounting metrics and ratios in Power BI.
The dashboard some high-level metrics at the top such as Sales, COGS, Gross Margin ant etc. The dashboard also shows the growth of these metrics comparing to last year.
The top section focuses on sales and cost of sales per month, and quarter.
The section below shows balance sheet metrics on assets and liabilities as well as operating earnings.
The filters on the left enable client to filter by year, quarter, month and also switch between MTD and YTD view.

Support
All the support you need – when you need it. From 1-hour quick fix support to longer-term partnership that drives your business forward.

Consultancy
Advanced data thinking, creative ideas and the best Power Platform practices to unlock the true potential of your business data.

Training
Succeess shouldn’t be a one-off. When we train you teams user adoption surges and your Power Platform results radically improve.
![]()
![]()
![]()