One of the recurring requests that we receive from our clients is to build them a Power BI real estate dashboard. This is a common requirement from real estate investors who want to monitor their investment portfolio performance. We have also built Power BI real estate dashboards for property management companies who are responsible for all the operational work around the real estate properties.
In this article we will show an example of a typical Power BI real estate dashboard that we build, explain the process of building one and tell you more about how our clients use them.
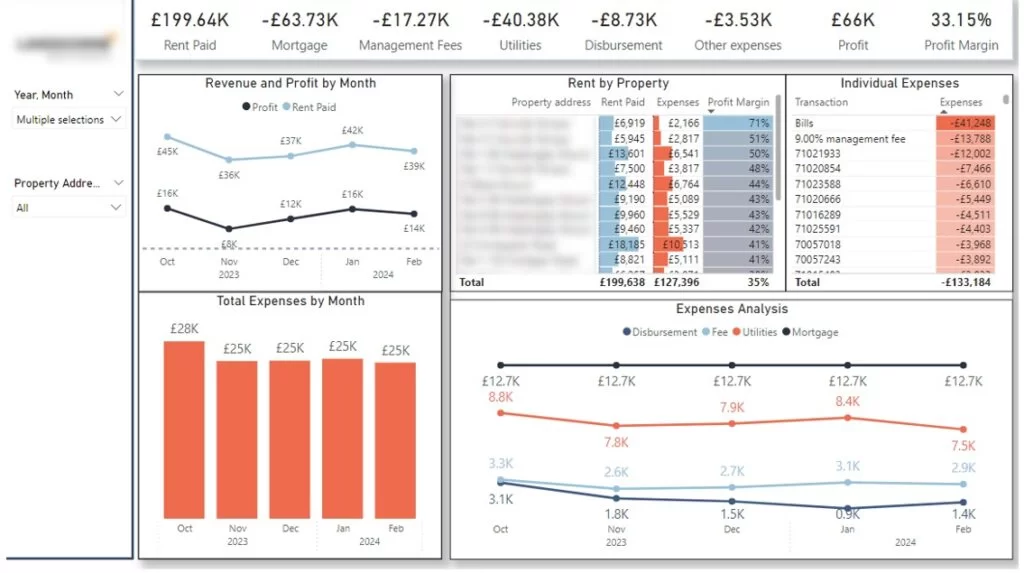
If you want to create a Power BI real estate dashboard, the first step is to identify the KPIs to analyse your portfolio performance. In our experience as Power BI consultants, the main real estate KPIs are the following:
In terms of data storytelling, we organise the graphs on our Power BI real estate dashboards in a consistent way. We start by a line of card visuals at the top to give some quick insights about the overall performance of the portfolio.

We then try to give some context to those key metrics by showing how they change over time. We do this through the trend charts you see below.
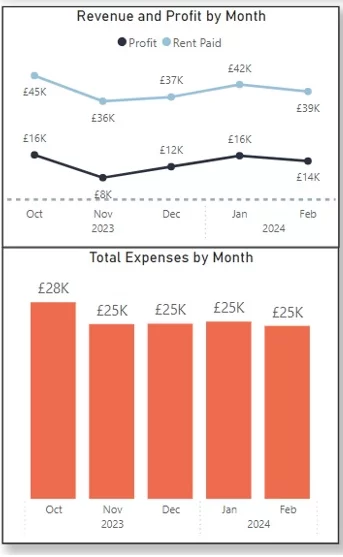
We then analyse the individual factors that influence the change of those key metrics namely rent, expenses and profit. We analyse the performance of each real estate property and the trends for each key expense group. Finally, the analysis of individual expenses allows us to determine any irregularity which helps to explain the fluctuations in expenses and profit.
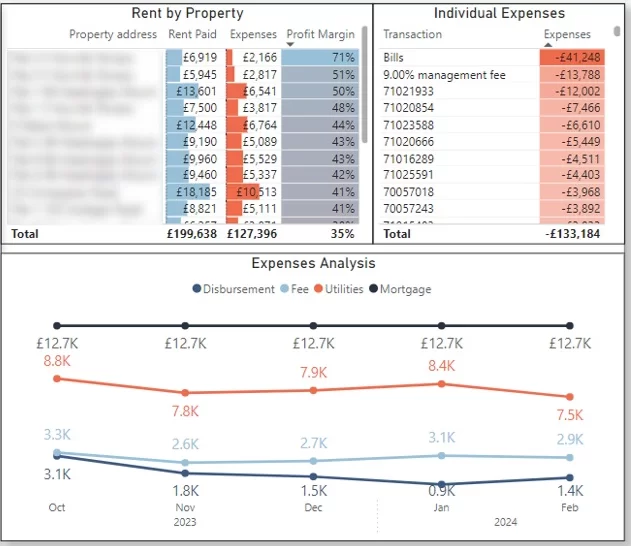
The clients usually can dig deeper into the data by filtering to a specific property using the filters on the side
Sometimes we also create Power BI dashboards to analyse the actual performance of every property vs planned performance. Our clients often receive Excel sheets with pro-forma P&L before they make an investment decision. Once they invest into a property they often want to analyse their performance vs budget.
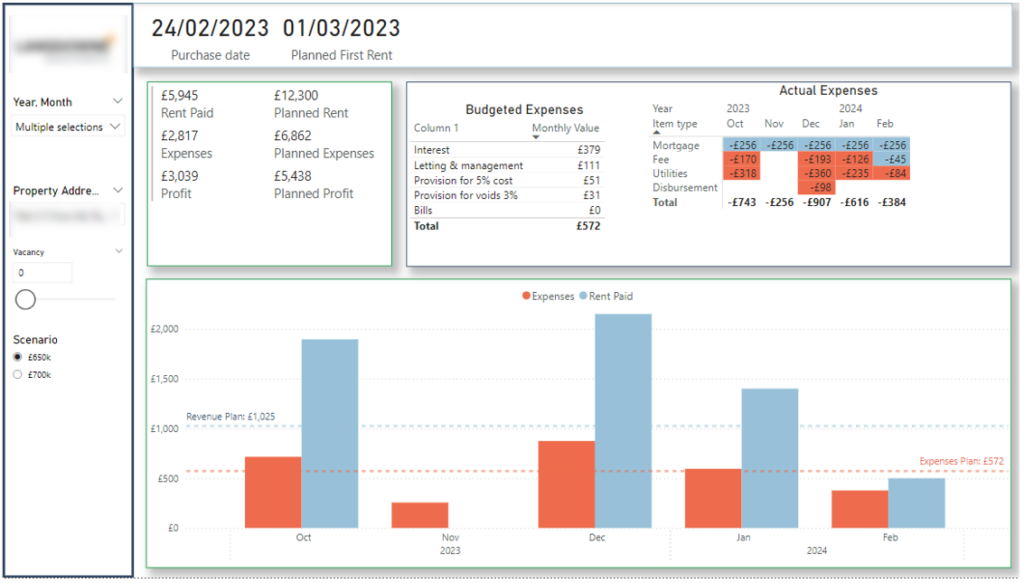
We follow the same principles when designing these Power BI real estate dashboards. We start by showing the total performance of a property for the selected period of time.

We then compare the monthly revenue and expenses to the planned amount.

Finally we analyse each expenses group to see whether the performance is better than the budget or worse. We mark the performance which is better than the budget in blue and the performance that is worse than the budget in red.

Typically you would need the following data sources to create a Power BI real estate dashboard:
It is possible to automate the data extraction process by using Power BI connectors but very often using those connectors is not essential. In most cases the property managers and investors review their portfolio performance monthly rather than daily. Therefore, exporting the data to Excel before loading it to Power BI is often a simpler option than paying for additional integrations.
At the end of the month we would refresh our Power BI real estate dashboards with the latest data and prepare a write up with our analysis for the client. You can find the analysis
The Power BI real estate dashboard is then used to identify the properties where the rent increased or decreased

We also used our Power BI real estate dashboard to identify the real estate properties that have been unprofitable for a long time.
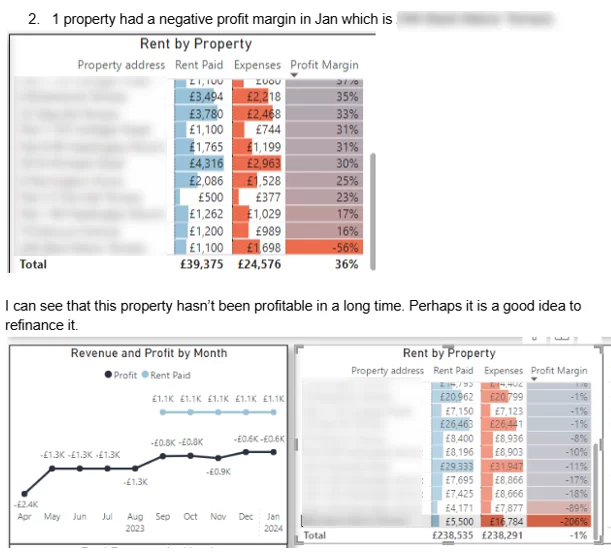
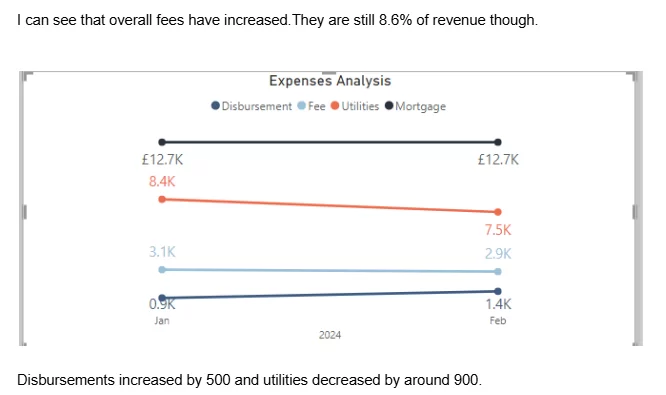
Finally, we send our clients the analysis on all the expenses groups. We identified the expenses types that are going up or down and their overall impact on the portfolio profit.
Our Power BI consultancy has built 1000+ Power BI dashboards for our clients! Simply contact us today to discuss the data analysis that you want to create!
You can also view other examples of our work from our Power BI portfolio!
Support
All the support you need – when you need it. From 1-hour quick fix support to longer-term partnership that drives your business forward.
Consultancy
Advanced data thinking, creative ideas and the best Power Platform practices to unlock the true potential of your business data.
Training
Succeess shouldn’t be a one-off. When we train you teams user adoption surges and your Power Platform results radically improve.