As the world of work rapidly changes, companies are realizing they need better systems in place to manage their operations, projects, and teams. ClickUp has emerged as one of the leading project management and collaboration platforms that is truly transforming businesses.
Here are five keyways ClickUp is revolutionizing how modern companies work:
One of the biggest challenges businesses face is managing information silos. Important tasks, conversations, files, and notes end up scattered across various apps like email, instant messengers, cloud drives, documents, spreadsheets, and more. This fragmentation slows down productivity and causes confusion.
ClickUp solves this issue by centralizing everything teams need to get work done on a single platform. Tasks can be created, assigned, tracked, and collaborated on. Conversations stay connected to the relevant tasks right within ClickUp, eliminating the need to jump between different apps. Important documents can also be uploaded and shared within the platform. This unified system finally lets teams work faster and smarter.
Every business has unique needs when it comes to managing projects and work. Building customized systems to match specific team workflows used to be extremely expensive and time-consuming.
ClickUp makes customization fast, easy and affordable with its flexible platform. Teams can create multiple views like Grid, Board, Calendar, Gantt Chart, etc. to fit how they plan. Custom fields, statuses, tags, reminders and other elements can be set up without coding to match existing processes. Teams can build the perfect workflow environment tailored to their requirements with just a few clicks.
Siloed software systems make it harder for cross-functional teams to collaborate. With marketing using their own project management apps, engineering sticking to their Jira tickets, and sales doing account management in their CRM, alignment suffers.
ClickUp enables different departments to come together under a shared workspace. Marketers, product developers, HR, finance etc. can create customized views while still being connected by shared tasks lists, company goals, schedules, and conversations. This makes processes transparent helping teams stay on the same page. Leaders also get better visibility for decision making.
Manually managing repetitive tasks like collecting timecards, integrating multiple apps, transferring data between systems consumes precious time that should be better spent on value-add analysis and strategic thinking.
ClickUp lets businesses configure no code automation rules that can eliminate these mundane responsibilities. Tasks can auto-assign based on custom logic, updates can trigger notifications, new records can be automatically synced across integrated apps like email, Google Drive, GitHub and more. Not only you can set up basic automation, but you can also implement your complex workflows with the help of automation software, custom webhooks, the right triggers, relevant info, etc. Agencies like UpSys Consulting offer professional services to help you with this. This saves hours of manual effort each week, boosting productivity.
As startups and small businesses rapidly add customers and hire more people, their existing systems struggle to efficiently scale, leading to service gaps, confusion, and duplication of work. Transitioning to more robust enterprise platforms ends up being complex, expensive and disruptive.
ClickUp truly delivers with the scalability growing businesses need as it’s built for teams from 1 to 1,000,000+. Multiple permission levels leave new hires onboard smoothly. Teams get unlimited storage, unlimited custom views and workflows. Robust enterprise-grade security compliance keeps important company data protected, even for low employee count startups aiming for hypergrowth.
While ClickUp provides excellent task and project management capabilities, integrating it with an analytics dashboard unlocks more advanced reporting, insights and visualization functionality to take effectiveness to the next level. Here are some key reasons to connect your ClickUp data to a BI solution like Vidi-Corp’s custom dashboards:
Rather than having to run multiple reports from ClickUp and assemble data manually in spreadsheets, BI integration places key metrics from projects, tasks, and workflows into a unified interactive dashboard. This gives executives and managers self-serve access to the information they need most in one place.
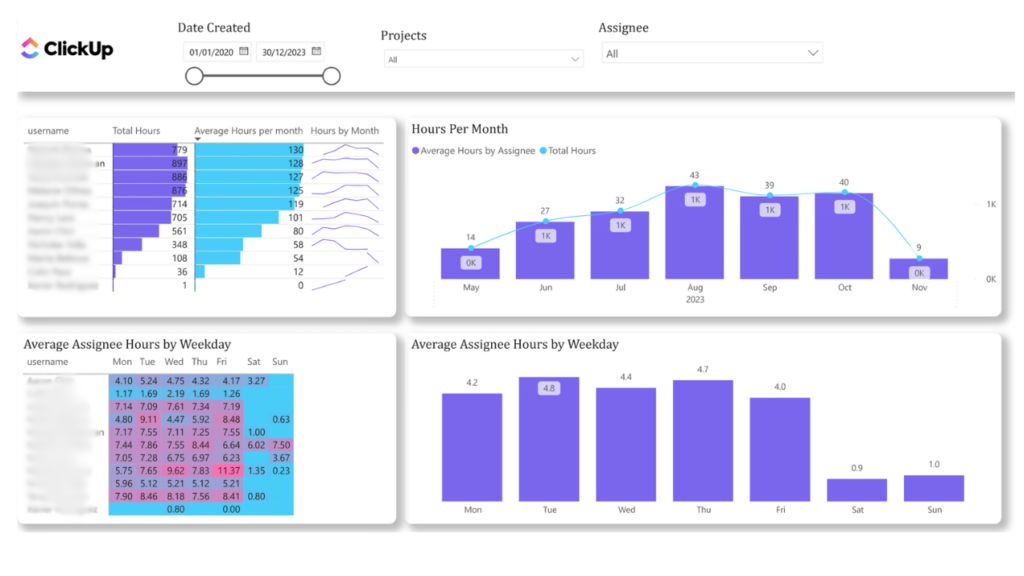
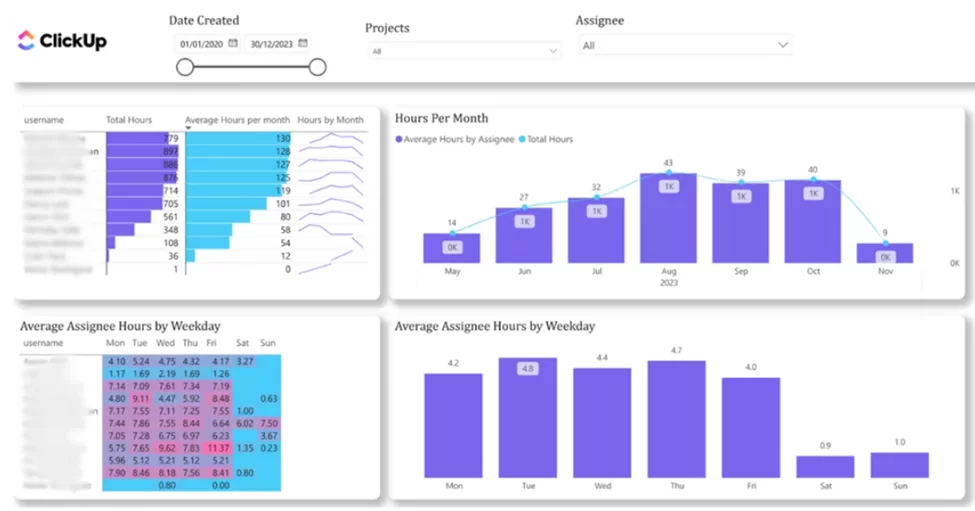
Simple tables and graphs have limited effectiveness for spotting trends and making data-driven decisions. Custom BI dashboards allow for advanced visualizations like heat maps, charts, gauge meters and more. These make it easier to gain insights from ClickUp task data rather than just raw numbers.
Fixed ClickUp reports can’t meet every ad-hoc question that comes up. Connecting ClickUp into BI widens the possibilities for managers to analyze from new angles. User filters, slices, multi-dimensional analysis and other features provide flexibility to get context.
Rather than having analysts export reports manually from ClickUp to share periodically, integrating with BI platforms like Vidi-Corp’s solution allows scheduled automated updates. This ensures the dashboard is always presenting real-time up-to-date project data and KPIs to inform better decision making.
Connecting ClickUp task data into analytics makes it possible to forecast future resourcing needs more accurately using historical performance. Managers can better predict upcoming staffing and workload requirements for projects. This ensures teams are right-sized. Bottlenecks can also be identified early.
With ClickUp integration, BI dashboards can track team metrics like tasks completed per person, cycle times by assignee, open tasks by age, and more. This gives management insight into productivity levels across individuals and departments. Laggards can be identified and further training provided. High performers can be modeled across the organization.
The enhanced visibility and insights unlocked from complementing ClickUp with real-time analytics is invaluable for organizations that operate complex workflows and large projects. The possibilities are truly endless on what types of tracking, reporting, and forecasting can be enabled through custom BI connected to ClickUp data.
Once ClickUp is integrated with a business intelligence solution like Vidi-Corp, the real power comes from building out fully customized dashboards matching your organization’s specific needs.
Here are just some examples of high-value dashboards that can be designed leveraging ClickUp data:
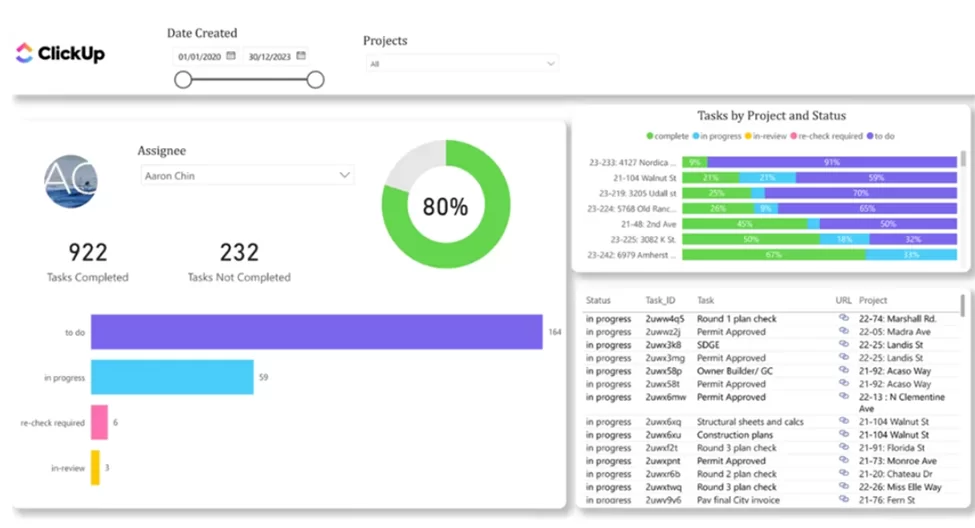
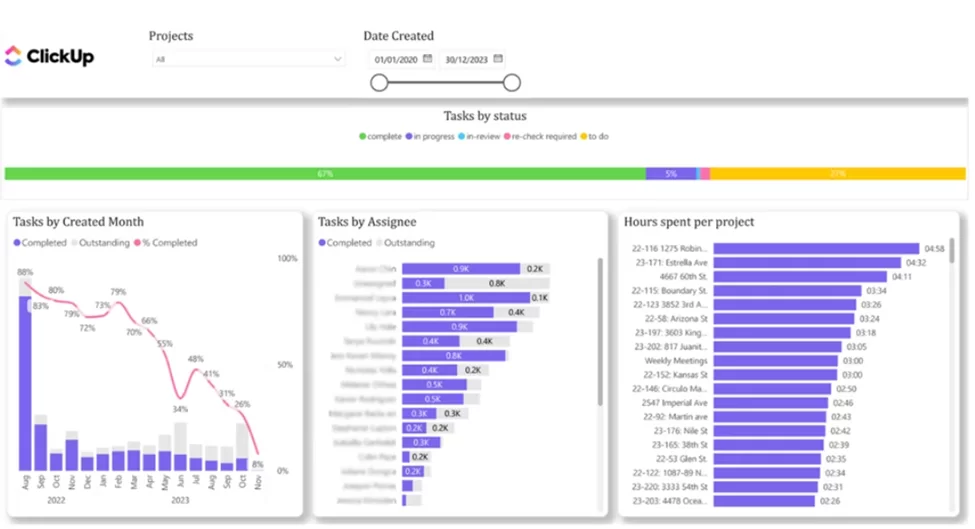
Get a bird’s eye view of projects from ideation to completion across statuses like “Requested”, “In Planning”, “In Progress”, “Completed”. Track the volume and velocity through each stage in the pipeline. Drill-down to task-level details. Identify bottlenecks like projects stuck in “In Planning” or projects taking too long in certain stages.
Visualize real-time and projected capacity versus assigned tasks for each team member. Instantly spot overburdened employees at risk of burnout based on allocated work compared to their max capabilities and historical velocities. Proactively rebalance tasks across the team to prevent missed deadlines.
Monitor the average time tasks take from being started to finished across teams, projects, and individuals. Alert managers if cycle times extend past expected ranges so they can intervene. Analyze trends in cycle time over time to optimize processes.
For teams using workflow automation in ClickUp, have clear visibility into the hours saved from auto-assigning tasks, triggering notifications, syncing integrated apps. Compare human hours spent on manual processes before and after automation. Show hard ROI numbers to leadership.
Ingest past project data from ClickUp tasks and feed into a machine learning model to predict completion dates and probability of on-time delivery for new projects. Help project managers establish realistic schedules and expectations. Continuously improve forecasts based on new data.
With deep ClickUp integration powering customizable dashboards, the possibilities are truly endless for the visibility and insights you can provide to your teams and leadership. The use cases above are just the tip of the iceberg for how to inform better decision making across project and task management.
If you use ClickUp extensively across your organization and need to unlock more value through reporting, analytics and insights into your projects, workflows, and teams, Vidi Corp can help.
Our experts have built connectors into all major platforms like ClickUp to feed data directly into our dashboard engine. Leveraging your own real-time company data, we can design, develop and deploy fully customized BI dashboards tailored to your specific business needs.
Some key benefits of partnering with us include:
We make it fast, easy and affordable to graduate from static reporting to real-time analytics with your ClickUp data fueling the insights.
Contact our team today to schedule a free consultation on building custom ClickUp dashboards optimized for how your business operates.
Whether it’s centralizing communication, building custom workflows, improving collaboration between departments, automating repetitive tasks or scaling cost-effectively from a small to large team, ClickUp helps transform businesses to fit for the new world of work. As remote environments, matrixed organizations, and cross-functional teams become more common, leveraging platforms like ClickUp will be key to unlocking productivity and maintaining competitive advantage. Contact us at Vidi Corp and create custom dashboards to get the most out of ClickUp for your business.
![]()
![]()
![]()