Have you ever wondered how to transform your business with Inventory Management Power App? Running an efficient business requires tracking inventory. Manual spreadsheet tracking is time-consuming, prone to errors, and doesn’t provide real-time visibility. That’s where a customized inventory management Power App can help.
In this article, we’ll walk through a real-world example of how Vidi Corp built an inventory Power App to solve significant business challenges for a US-based plant nursery.
Inventory is the lifeblood of any product-based business. Knowing what you have in stock, where it’s located, and when you need to reorder is critical for meeting customer demand.
Most small businesses still rely on Excel spreadsheets to track inventory. But spreadsheets have major limitations. Here are some of the common drawbacks associated with planning inventory in Excel.
Modern businesses need inventory tracking that is:
Our client sells live plants and containers to consumers and commercial customers across the United States. They were previously tracking thousands of SKUs using Excel sheets. But with a growing product catalog and inventory housed across multiple locations, their manual approach wasn’t sustainable.
Key pain points experienced by the business included:
To transform their inventory management, the nursery partnered with Vidi Corp to build a Power App connected to SharePoint lists and Power BI analytics.
Vidi Corp designed an all-in-one inventory management solution with the following key features:
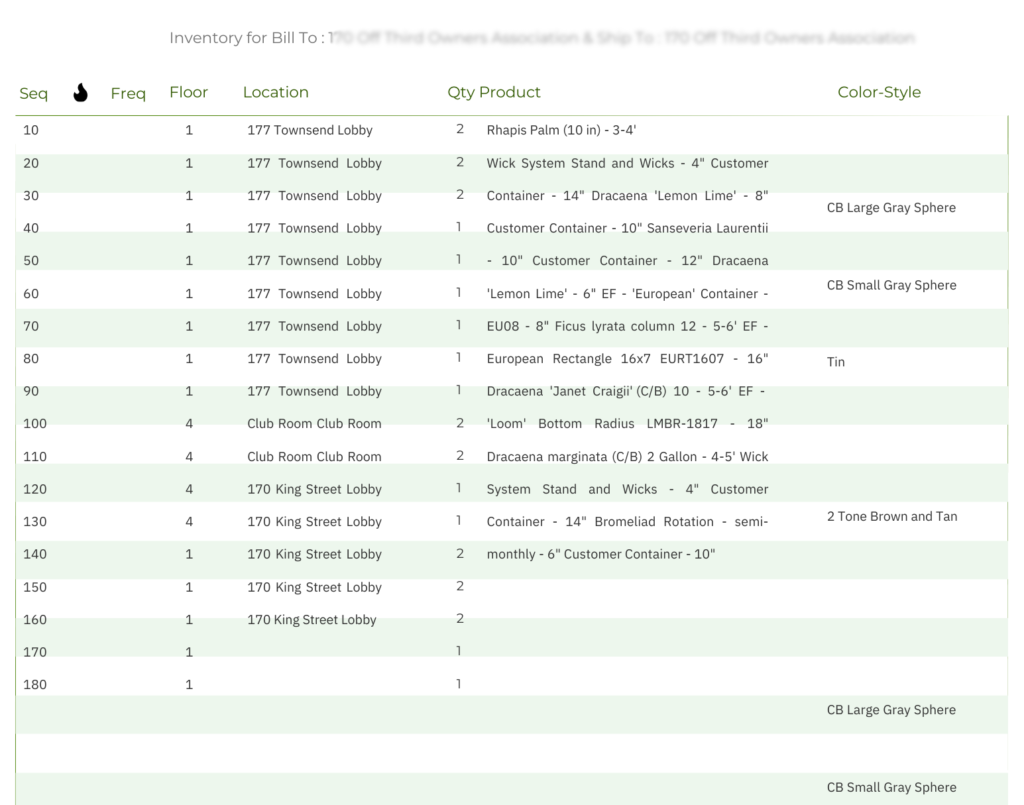
A key requirement for the plant nursery was support for both a “bill-to” address and “ship-to” address associated with inventory items. This accommodates business-to-business orders that have separate invoicing and delivery destinations.
Within the Power App, warehouse staff can select both a Bill-To and Ship-To company for inventory batches using simple drop-down menus. Common combinations can be saved for quick future selection.
Behind the scenes, Vidi Corp configured cascading filter logic based on these selections. Choosing a Ship-To company filters the visible warehouse locations to show only the valid fulfillment facilities that can support deliveries for that customer.
Likewise, picking the Bill-To company automatically applies to that business location as the default accounts receivable address for order invoices. However, overrides can still be made on individual orders as needed.
Tracking paired Bill-To and Ship-To sites against inventory enables efficient picking, packing, shipping, and billing processes. Staff process orders faster when the required customer context follows inventory through the system.
Integrating with shipping software like Ship Station, the nursery can print new freight labels simply by referencing the linked ship-to details for inventory batches. The correct delivery address and contacts pull directly from the Power App into the shipping workflow.
End-to-end order orchestration becomes possible when leveraging bill-to and ship-to connectivity tied to centralized inventory data within Power Apps.
Vidi Corp built an integrated Power BI analytics dashboard on top of the inventory management data stored in SharePoint lists. This dashboard updates every 4 hours, providing executives and managers with a near real-time overview of inventory metrics. The visual interface makes it easy to slice and dice data on the fly.
Some of the pre-configured views include:
To support evolving business needs, Vidi Corp built administrative functionality for managing inventory setup right within the Power App interface.
Located under the Settings icon, authorized users can configure both company-wide inventory filters as well as the master product catalog.
The Manage Whole Inventory settings page offers a bird’s eye snapshot of current inventory levels across all warehouse zones, buildings, and racks.
While frontline staff may only interact with inventory records assigned to their work area, executives can view aggregate quantities in this macro dashboard.
Filters allow slicing the inventory data along:
Regardless of how filters get applied, the settings overview displays key figures like current stock quantity, ideal par stock targets, and days of supply remaining before hitting minimum thresholds.
From this centralized perspective, administrators can pinpoint global inventory shortages to expedite transfers or reorders. Bulk exporting filtered datasets as PDFs assists further number crunching or presentations.
In addition to inventory visibility, authorized staff manages the backend product catalog within the Settings section.
This master dataset houses all details constituting valid SKUs like:
Editing or adding new products instantly syncs changes across the entire business. Frontline staff access the latest items when performing inventory counts or order fulfillment tasks.
Between centralized inventory oversight and configurable product data, the Settings page truly functions as command central within the Power App.
The dashboard allows endlessly customizable filtering to home in on products, warehouse zones, frequency groups, and other attributes. Search functions also quickly locate inventory elements.
The Power App provides an intuitive mobile interface for staff to view, update, or add new inventory records on-the-go. Data fields capture all critical details like:
Advanced filtering and search functionality allows users to instantly look up inventory items.
As warehouse staff scan barcodes or enter changes via the app, the SharePoint data list updates in real-time. This ensures the system always reflects the latest inventory quantities and tracking details, similar to what dedicated inventory platforms like BlueTally provide.
For initial configuration, the app supports bulk upload of the product catalog and existing inventory counts via Excel spreadsheet templates. This saved significant time instead of manual data entry.
To keep records organized as new SKUs get added, the Power App auto-sequences inventory line items. Users can also easily re-sequence groups of items with a couple clicks.
Inventory data lists can be exported as PDF reports for printing or sharing with stakeholders. This helps compile inventory accounting records or review before placing purchase orders.
Alongside the mobile data access app, Vidi Corp built an integrated Power BI dashboard. This unlocks inventory analysis at an executive level.
Key metrics provided include:
Ongoing dashboard updates ensure numbers stay current for data-driven decisions.
With their new inventory management Power App, this plant nursery gained these transformative business benefits:
The app also delivered impressive productivity savings. This is due to the staff hours previously lost to spreadsheet wrangling. It is not possible to use the dashboard to gather value-added tasks like order fulfillment with ease.
On top of operational improvements, the nursery is positioned for easier expansion thanks to scalable systems and processes.
Like this client, your small business can realize tremendous time and cost savings using Power Apps. Contact the experts at Vidi Corp to discuss building a custom inventory management solution tailored to your needs. Transform outdated business processes to unlock efficiency and support future growth.
![]()
![]()
![]()