This Power BI sales pipeline dashboard was created for a global company with 400k+ employees that needed help automating reporting from Salesforce, Webeo and Linkedin Ads. It used to take them 6 hours of manual work per report refresh and they wanted to refresh this report on a daily basis.
The Power BI dashboard covered the analysis on the impact of the marketing department on the overall sales pipeline of the company. The key stakeholders included the Global Head of Marketing and several regional marketing directors.
The client also complained about the look and feel of the existing reports. Those reports seemed unintuitive to follow and not looking professional enough to share with senior management. Therefore Vidi Corp Power BI consultants were engaged to help making Power BI sales pipeline dashboard more intuitive to follow.
We analyzed the existing reports with the client and identified the analysis which the client found useful. In addition, we identified the gaps in the current analysis which allowed us to put together a set of recommendations for additional KPIs.
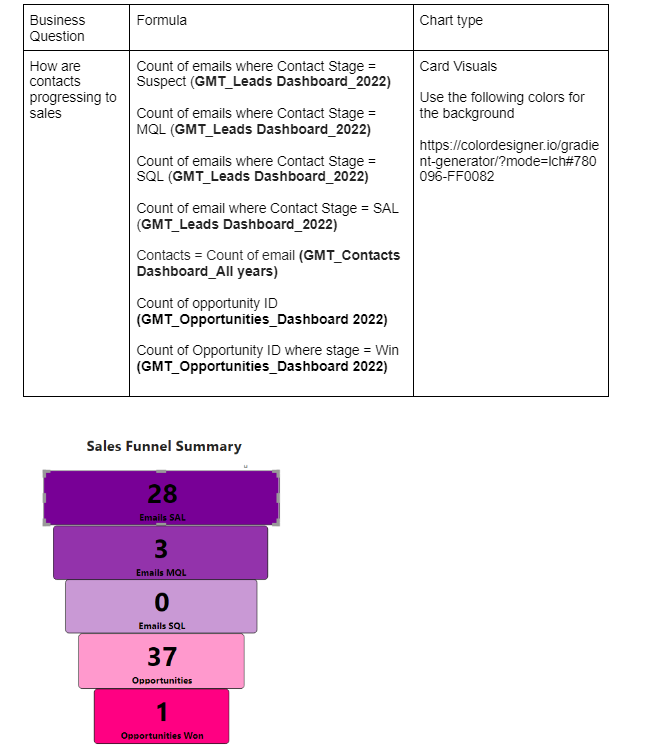
Our Power BI consultants created a document summarising:
Once the data was identified, Vidi Corp used proprietary connectors to extract data automatically from Salesforce and Linkedin Ads. Using those connectors allowed us to automate the data extraction process and schedule it to happen 8 times per day.
The manual data transformation steps that the client used to do were automated by using the formulas inside of Power Query. As a result no manual data transformation work was necessary to refresh the report.
The time needed to refresh the reports went from 6 hours to 0 as a result of the data extraction and data transformation automation.
A user-friendly and visually appealing Power BI dashboard was created which effectively communicated the value that the marketing department was bringing to the company in every region.
The dashboard was then used to optimise the marketing efforts since problematic lead channels in every country were identified through the dashboard
Finally, the following pages were created in Power BI to present the impact of the marketing department on the sales pipeline.
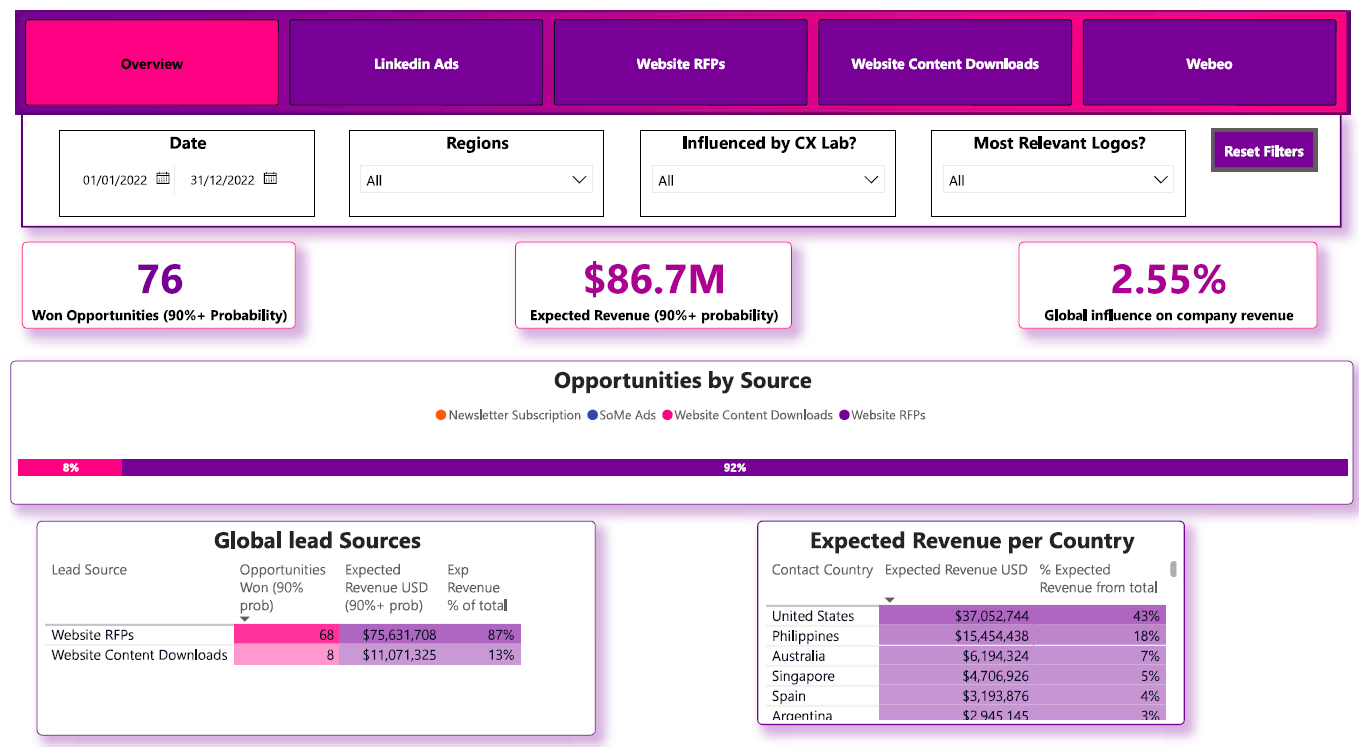
The top of the overview page highlighted the won opportunities, expected revenue and a percentage of expected revenue that came from marketing data sources.
This page also presented opportunities and expected revenue by lead source and customer country.
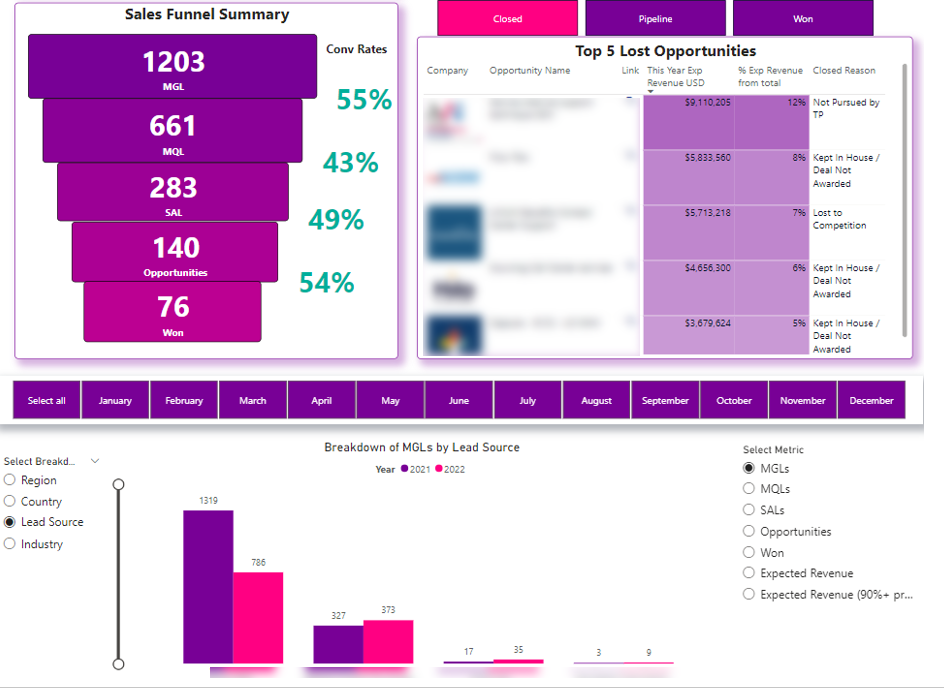
The bottom section of the page summarised the number of leads by funnel stage and conversion rates between those stages.
The table next to the funnel chart shows which potential clients are still in the sales pipeline, lost or won. The link icons in this table take the user straight to the relevant opportunities inside of salesforce where an action can be taken. An external API was used to automatically pull the company logos based on the lead website url.
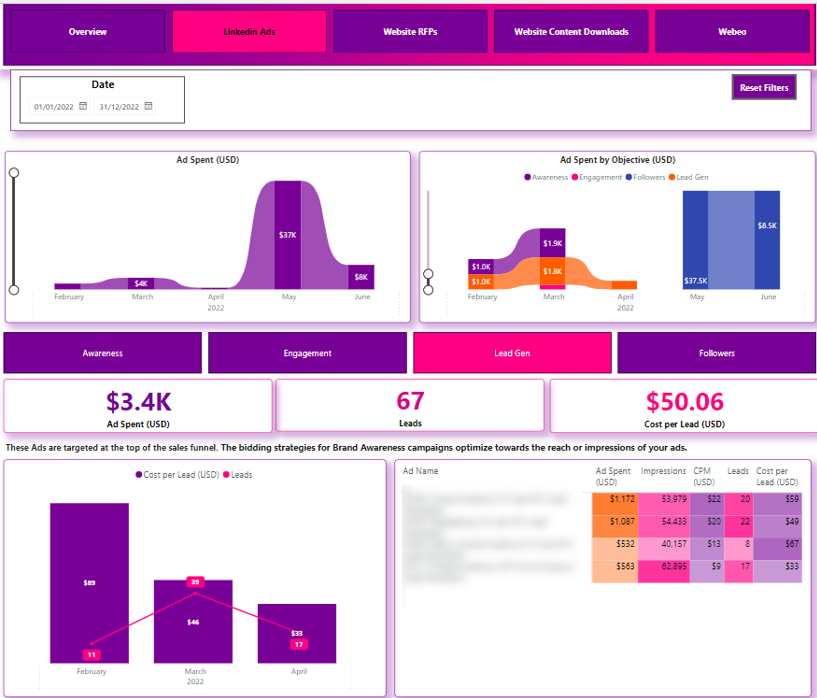
This page analysed the Linkedin ads spent and also the results that were achieved. A proprietary Linkedin Ads Power BI template was installed for this client. The data flow from Linkedin to Power BI was automated through the proprietary Power BI Linkedin Ads connector.
The purpose of this Power BI page is to analyse the leads in the sales pipeline that came from website RFP submissions. This page is mostly the same as the overview page. The consistent format throughout the report makes it more intuitive for the users to quickly find the needed information.
All the regions are compared to each other in terms of key metrics and number of generated leads is broken down by website page.
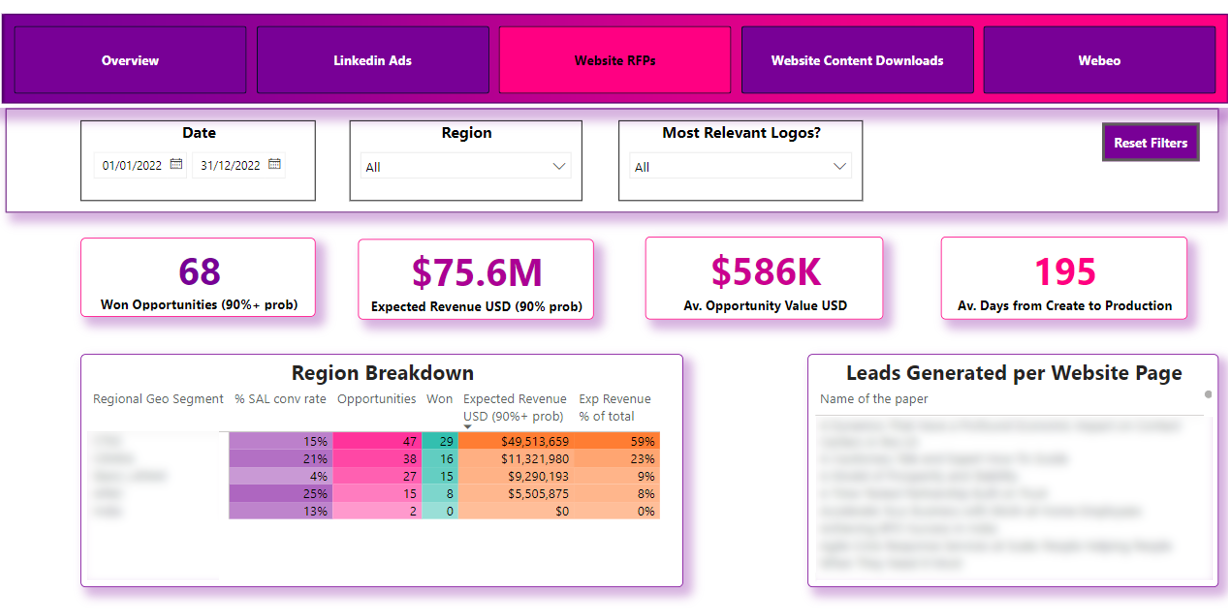
The rest of the page is the same as the overview page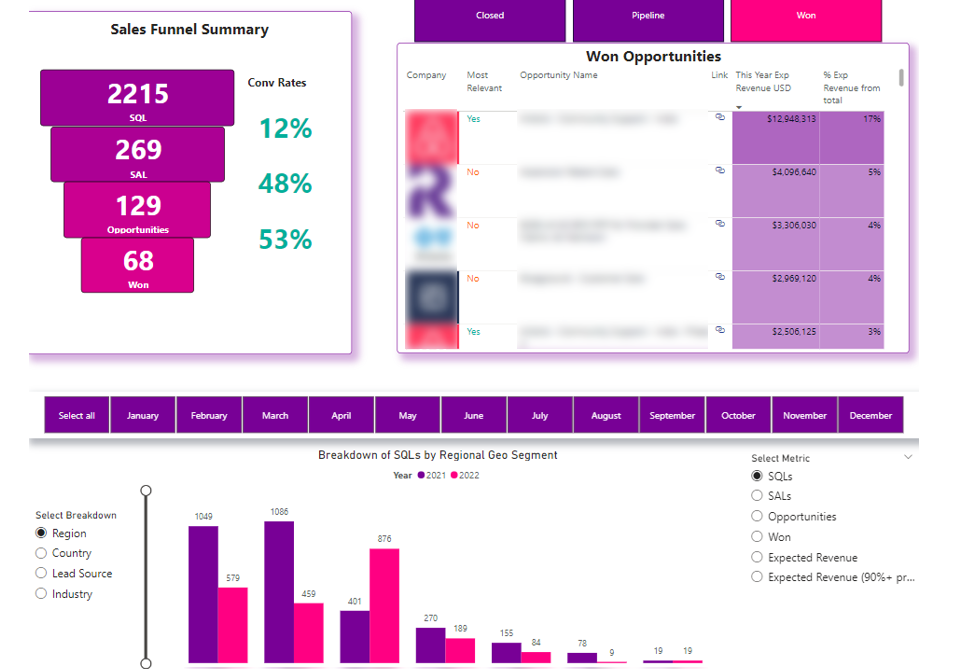
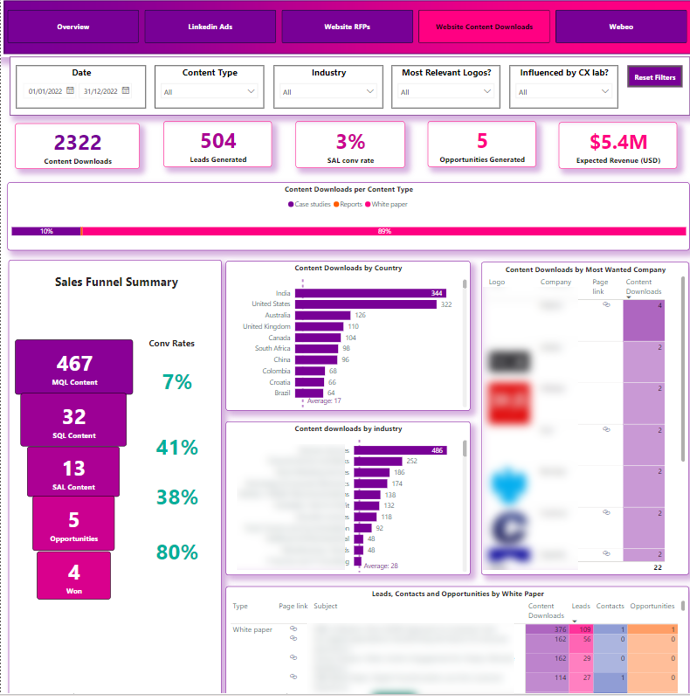
This Power BI page analyses the opportunities and leads which were generated through lead magnets on the website. The number of leads is broken down by type of content that was downloaded and the specific name of the content piece. We also analysed what industries the leads who downloaded content were from. A link icon takes the user directly to the relevant content piece
Does this case study look relevant to your upcoming project? If so, contact us now so that we can recommend

Support
All the support you need – when you need it. From 1-hour quick fix support to longer-term partnership that drives your business forward.

Consultancy
Advanced data thinking, creative ideas and the best Power Platform practices to unlock the true potential of your business data.

Training
Succeess shouldn’t be a one-off. When we train you teams user adoption surges and your Power Platform results radically improve.
![]()
![]()
![]()