Do you want to optimize the performance of your PPC marketing campaigns? Then you should have custom PPC Dashboards created to keep track of your campaigns. This is where we at Vidi Corp can help you.
Our advanced PPC dashboards provide transparency with your campaigns. They consolidate metrics from platforms like Facebook Ads, Google Ads, LinkedIn Ads and more to offer a unified view of key metrics.
With intuitive interactive visualizations, we empower clients to understand campaign results and collaborate effectively on optimization strategies. Read on to learn more about our powerful PPC dashboards.
Our team has the expertise to offer PPC dashboards for numerous platforms. Let’s take a look at them in detail.
When it comes to PPC, we often run our campaigns on Google or Bing. That’s because they are the most popular search engines among people. You can track the performance of your PPC ad campaigns on both these search engines with our dashboard solutions.
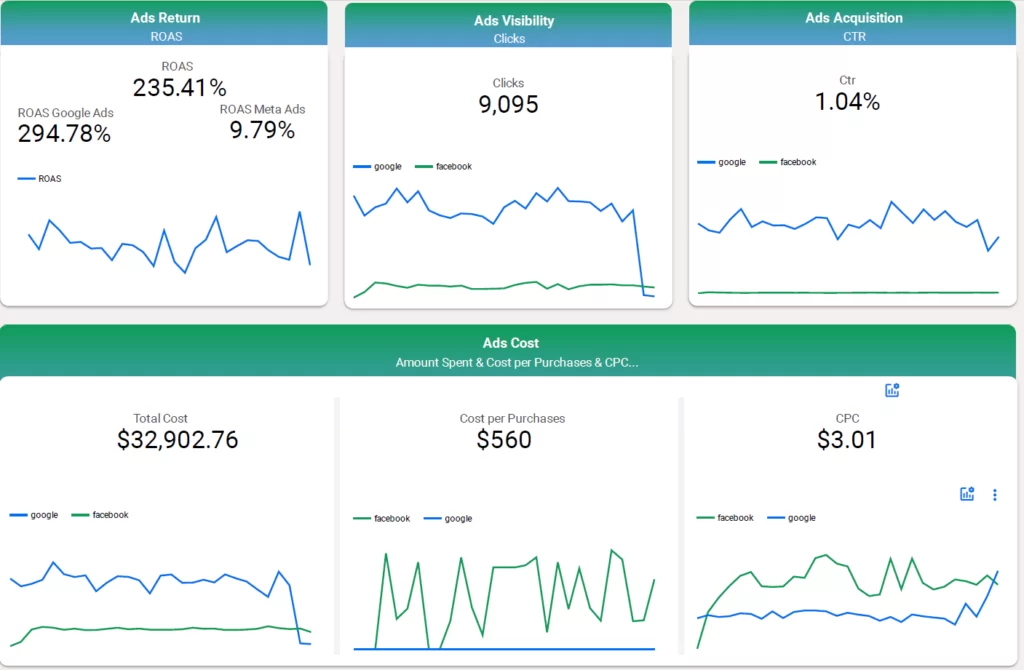
For example, we can help you create a single dashboard, which allows you to explore your ad expenses. It includes the CPC, cost per purchase, and the total amount you spend. Likewise, you will also be able to see the number of clicks your ads generate, number of conversions you secure and the return of your investment.

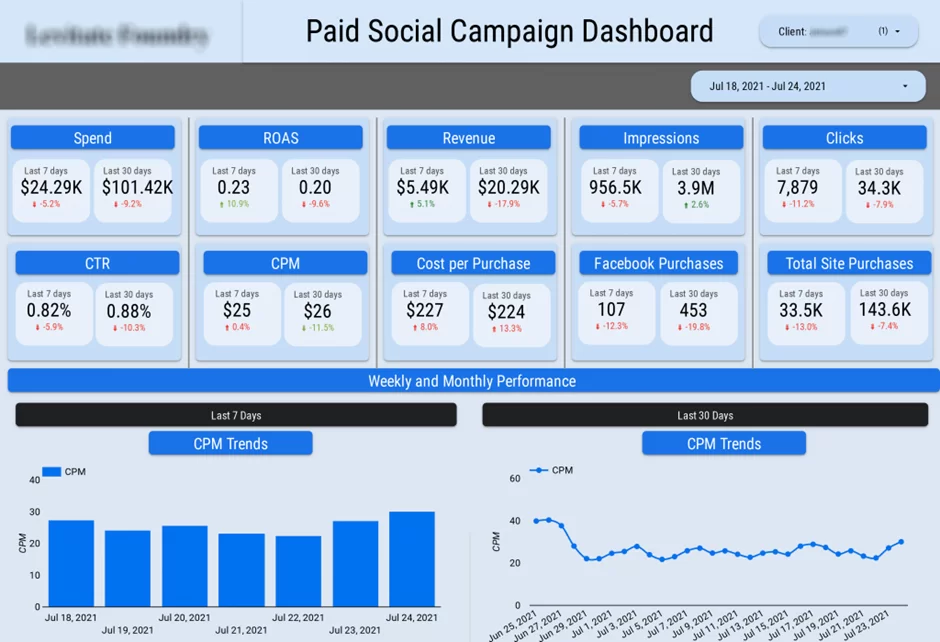
Facebook is a popular social media network where you can run your ad campaigns. No matter what your business is about, you will be able to find your target customers on Facebook. However, it is important to know how to track results as you run an ad campaign on Facebook. This is where our dashboard solutions can help.
Through the Facebook ads dashboard, you can see how much you are spending on the ads along with time. On top of that, you can also see how many conversions you are generating. It will help you understand the conversion ratio.

LinkedIn is a social media network for professional connections. If you are reaching out to an audience on LinkedIn, using LinkedIn ads is a great option to consider. But how can you check whether your LinkedIn ads are delivering profitable returns or not. You can simply do it with a dashboard we deliver.
We will help you create a centralized dashboard, which tells how much you are spending on LinkedIn ads. It will also show the total number of impressions your LinkedIn ads got, along with the number of clicks and CPM. On top of that, you will also be able to understand the cost per click and CTR with visual graphs.


Our cross-channel PPC dashboards integrate data from multiple ad platforms through automated pipelines. This gives marketing teams a centralized reporting system to evaluate budgets, spending and results across campaigns.
Dashboards can be filtered by client, account, campaign type or date range for flexible analysis. With a few clicks, you can view metrics for all clients or drill down into specifics of individual campaigns. This unified visibility makes it easy to identify high and low performers to shift budgets appropriately.
Our automated data integration means dashboards surface fresh data as soon as new results become available. This enables responsive optimization based on the most recent performance indicators.
We follow a streamlined sequence of steps to provide clients with fully automated, custom PPC reporting dashboards:
Our engineers establish automated pipelines to pull performance data from all your Google Ads, Facebook Ads, LinkedIn Ads and other PPC accounts on a daily basis. We leverage our custom connectors to extract the relevant metrics for your business
Next we consolidate data from all sources into a centralized database e.g Azure Sql or directly into the dashboarding tools like Power BI. This enables unified cross-channel reporting and flexible filtering options.
Our visualization experts take stakeholder needs into account and hand-craft custom dashboards with intuitive, insightful graphs and layouts tailored to PPC analysis needs. The dashboards enable unique PPC campaign insights through visual data exploration.
User administration tools and permissions cater dashboards to your organizational structure. Client filters give visibility into respective campaign results while hiding competitors’ data, enhancing security.
For agencies managing data on behalf of clients, our dashboards support white-labeled external sharing capabilities. This allows each client to privately access custom reports containing only their own PPC data at any time.
At project end, you retain full ownership which includes in-house data integration capabilities, customized dashboards, and flexible maintenance from our team. This hands-off automation enhances productivity and keeps your analysis capabilities future-proof.
At the successful completion of our dashboard development project, clients receive a set of comprehensive deliverables to enable ongoing value:
We set up scripts and APIs to pull performance data daily from Google Ads, LinkedIn Campaign Manager and other ad platforms into cloud data stores. This enables hands-off, up-to-date reporting.
The core deliverable – custom interactive dashboards providing campaign transparency and insights to optimize spend and strategy. Developed in Looker, PowerBI or other BI tools based on stakeholder preferences.
We work closely with you to design graphs, charts and layouts that align to your analysis needs. Intuitive visualization transforms complex data into actionable insights.
Dashboards support filters to view data by client, account, campaign type or date range. This enables flexible segmentation for reporting needs.
Our team will continue managing underlying scripts, data integration checks and monitoring for a seamless reporting experience. We also assist with new requirement implementations.
If you’re ready to gain better visibility into your PPC results take a look at our demo dashboards or request a free consultation. Our marketing analytics team is happy to guide you towards the reporting solution that best meets your needs.
Combine Facebook, Google Ads, Linkedin Ads, Bing Ads/Gads