
Eugene Lebedev is a Power BI consultant by background. Before founding Vidi Corp in 2021 he created Power BI reporting for Autodesk. His Power Bi reports were used by VPs of Finance and C-suite of Autodesk. As part of Vidi Corp, Eugene created dashboards for Google, Teleperformance, Delta Airlines and 200+ clients worldwide.
This article will help you to understand and use Power BI Append vs Merge functions – some of the most powerful functions inside of Power Query.

Both of them allow you to join several datasets into one, but in Power BI Append vs Merge are quite different. In short, merge is used to bring new columns into the dataset whereas append is used to bring more rows. Let’s look into them individually to understand them better. Including an explanation Power BI Append vs Merge video as well.
To see how you can optimise your reporting with Power BI, make an enquiry here.
Merge works like a Vlookup in Excel. In order to run the merge, you need 2 tables. Those 2 tables need to have 2 columns with matching values. I am going to use the Adventurewords2017 database in order to demonstrate this.
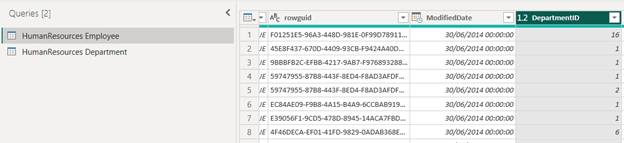
I have one table called HumanResources Department and one other table called HumanResources Employee. There is a column called Department ID in the Employee table.
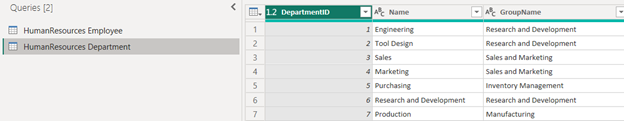
There is the same column inside of the department table
Now suppose that you want to have your department name instead of department ID inside of the Employee table. In this case Merge is your friend!
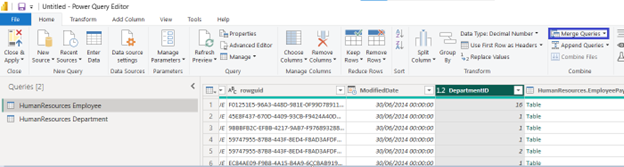
Start your merge by pressing the “Merge Query” button inside the “Home” ribbon.
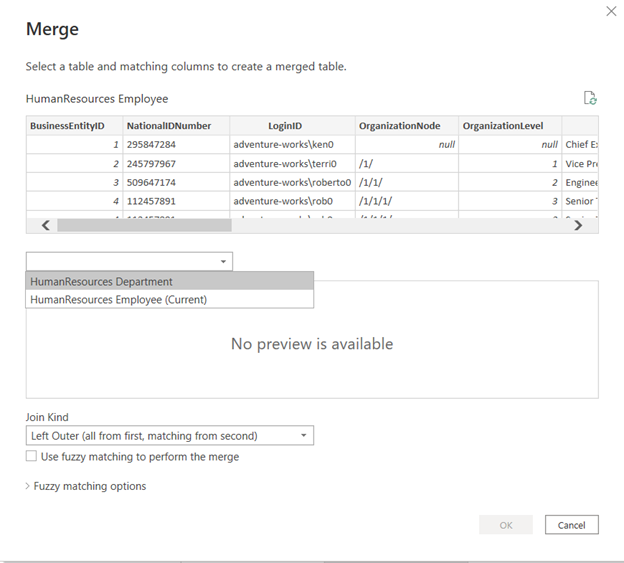
Once you press it, Power BI will bring up the next menu which will ask you to choose the second table for the merge. At this point you can select the Department table.
You then need to select the columns based on which you want to do the merge. You can do this by left-clicking on those.
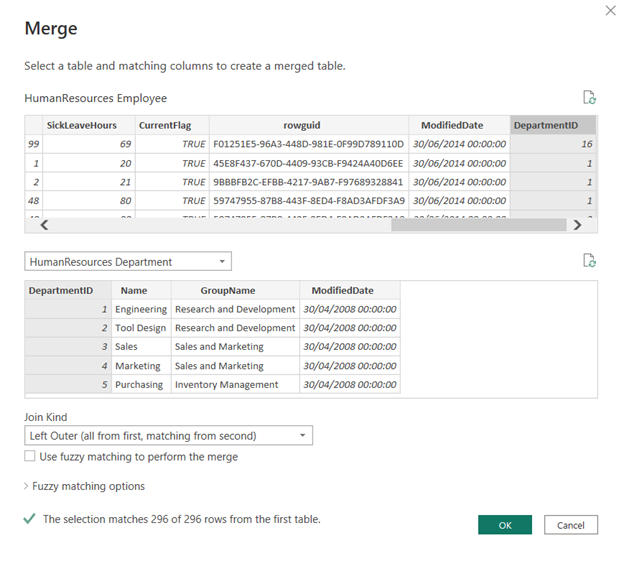
The final thing for you to do is to select the merge type. Different merge types are a big topic that really deserves its own post. This is why I wrote one! You can read it here!
Finally, once you click ok, you will see a new column appearing on the right. This means that the merge was successful.
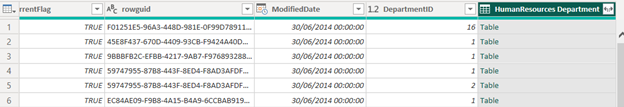
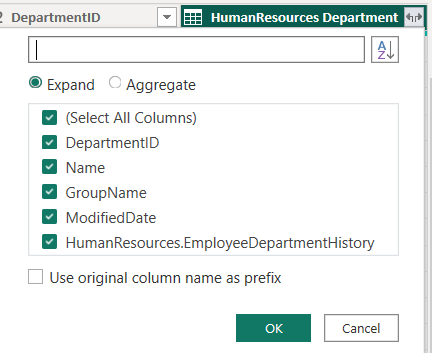
You can click the “Expand” icon to see which columns you can now add into your dataset.

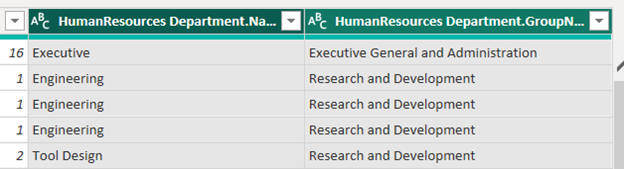
If you put a checkmark near “use original column name as prefix”, your columns will come out with the prefix “HumanResources Department.” in their name.
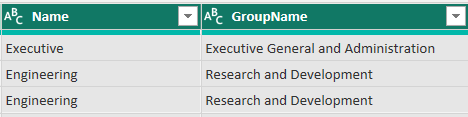
If you untick this box, the resulting column names will be like this
Watch out for duplicates!
One thing that threw me off when I first got into merge, was that sometimes the number of rows increases when you expand your merged table. For example, before the expansion, there were 290 rows and after it, there were 296.
This happens when there are some duplicates in the table that you are merging. For example, if we merge the employee table with the department table, some employees may have more than 1 department. Maybe those are the employees that were in one department first and then they moved to another department.
Therefore, I recommend you always make sure that the column you are selecting for merge in the second table contains unique values. If you notice that it contains some duplicates, remove them before the merge and this should fix this problem.
This was the most basic demonstration of merge. Let’s now look into some more advanced applications.
Merging the 2 tables based on one column in each table is not your only option! You can also do the merge based on multiple columns in each table!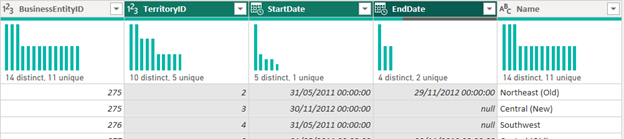
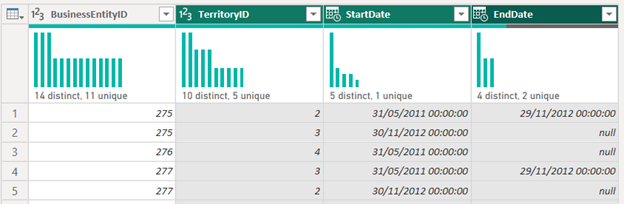
I have created an excel file with the following columns. I want to use columns Territory ID, StartDate and EndDate to bring the Name column into my SalesTerritoryHistory table
All I need to do for this is
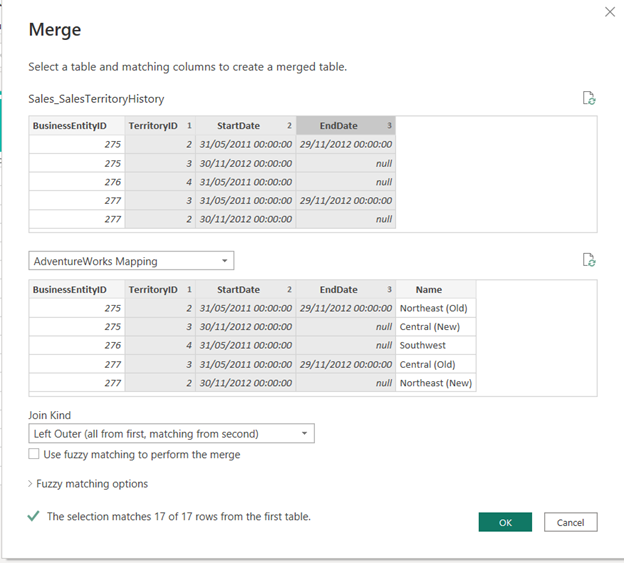
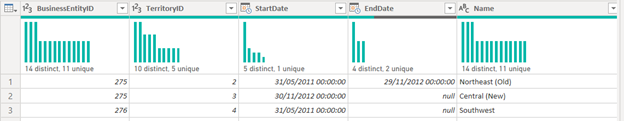
As a result, I will get my “Name” column into the dataset
You must have noticed the option to aggregate values instead of expanding values in the example above
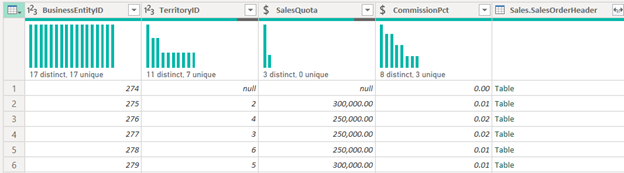
I am going to demonstrate what the aggregate function does use a different table called Sales_SalesPerson. In this table we have an ID of a salesperson, their sales quota and the commission that they pay.
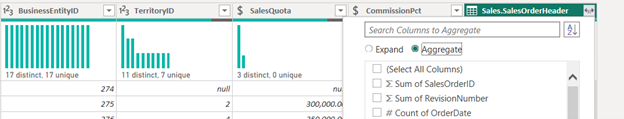
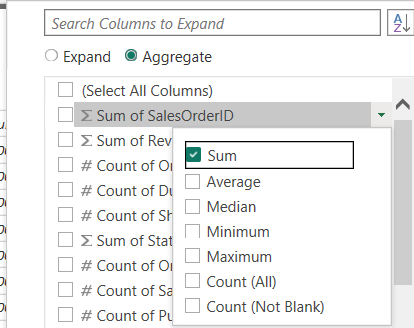
When we expand the SalesOrderHeader Table, we can switch from “Expand” to “Aggregate”
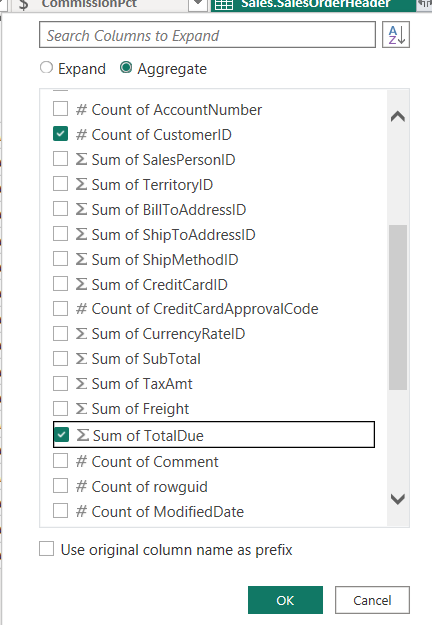
At this point, I can select which columns I want to aggregate
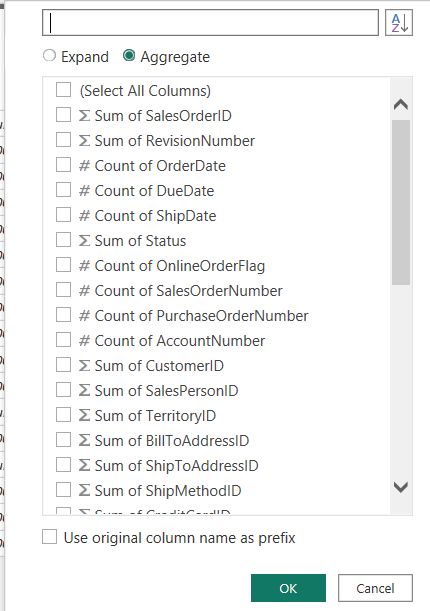
I can also select the type of aggregation that I need by clicking on the downward arrow
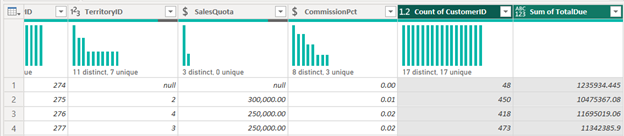
In this example, I will select the count of customers they sold to and the sum of value for their sales.
After I click OK, I can see those additional columns in my data now
Append is used when you have 2 datasets with the same structure and you want to combine them together into 1. Take a look at the example below.
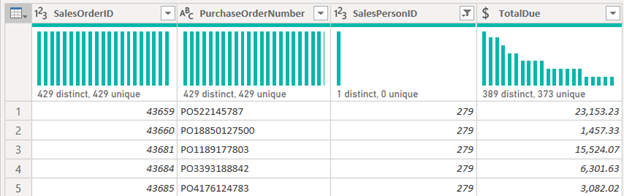
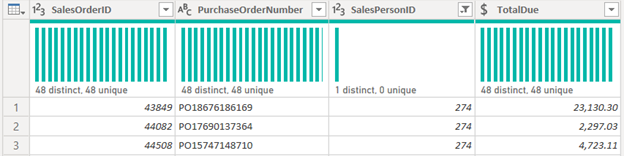
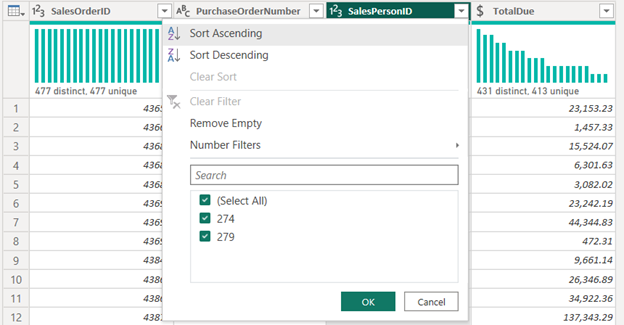
We have a table for sales of SalesPersonID = 279
We also have a similar table for sales of SalesPersonID = 274
You can combine them together by pressing the append.
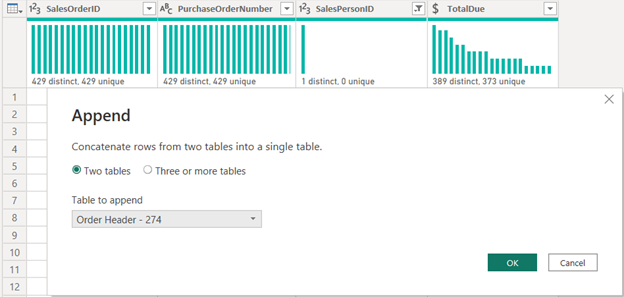
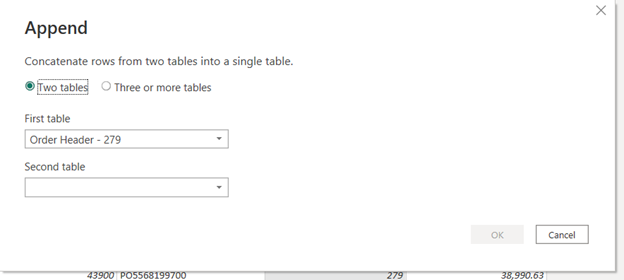
After you press it, the append menu will ask you to select the second table for the append.
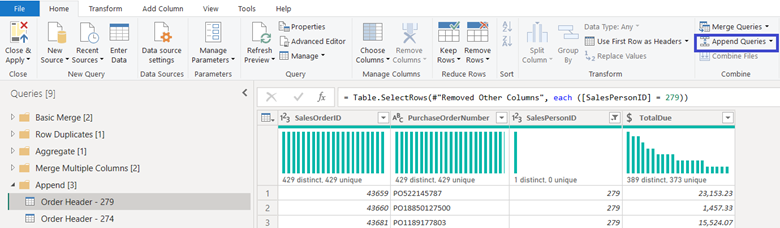
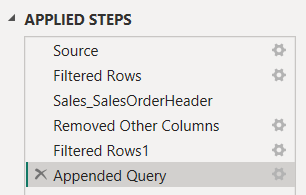
You need to select the second table and click OK. Afterwards, you will see a new step appearing in the applied steps menu.
You will also see that our dataset now contains data for both salespeople!
Watch out for differences in column names!
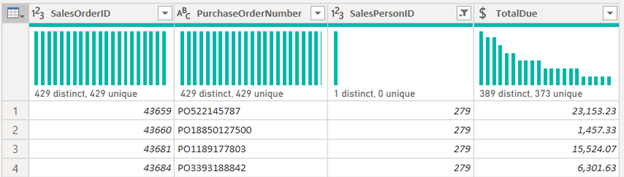
Let’s take the 2 datasets below as an example. The dataset with SalesPersonID = 279 has a column “SalesPersonID”.
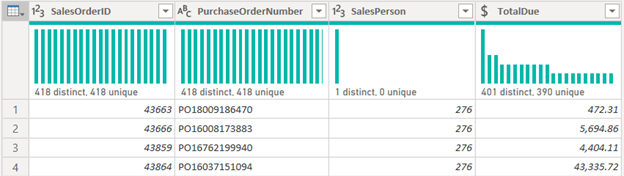
The dataset with SalesPersonID = 276 has a column “SalesPerson”.
If we append the 2 datasets together, the result will be as below. There will be 2 columns “SalesPersonID” and “SalesPerson”. Both of them will contain 50% of blank values.
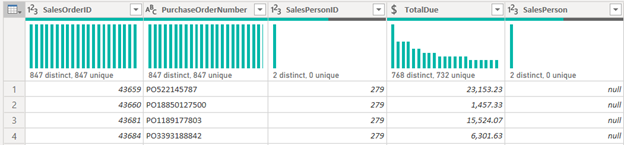
To avoid this behavior, make sure your column names are consistent. Go to your table with SalesPersonID = 276 and rename the column “SalesPerson” to “SalesPersonID”. This would fix this issue.
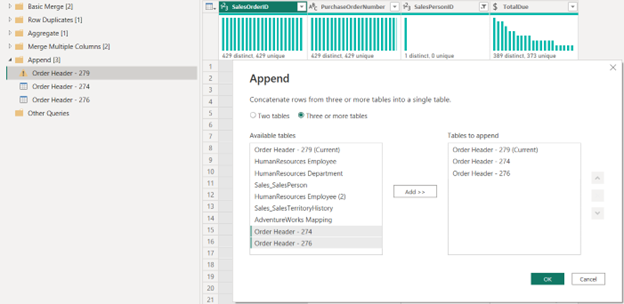
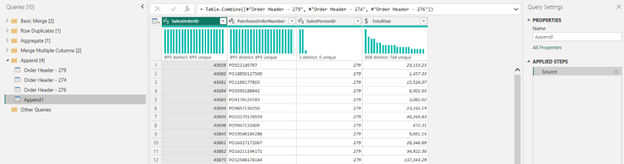
If we go into the original Order Header – 279 tables and press “append”, we will be able to switch to “Three or more tables”. At this stage, we will be able to select the other tables to append on the left. Press “Add” to add those tables and then you will see them appearing on the right.
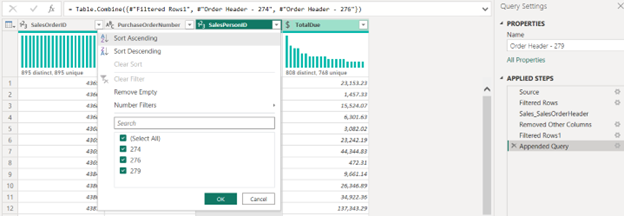
After clicking OK, you will see that the tables were successfully appended and you can now see all the SalesPersonIDs in a single table.
You also have an option of appending queries as new.
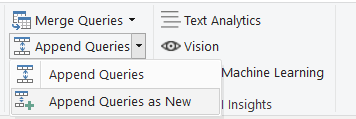
Selecting this option gives you the same menu as before.
However, after completing your append, you will find a new query called “Append1” appearing in your Power Query.
This table will contain the appended data from all the tables that you choose to append.
In conclusion, I want to reiterate that the merge function is used to add new columns to your dataset whereas append is used to add new rows.
I hope you find this article useful! Have fun appending and merging!
![]()
![]()
![]()