

ClickUp


Azure SQL Server

Power BI
Power BI ClickUp Integration by Vidi is the most convenient solution for integrating ClickUp data into your analytics workflow, solving multiple challenges.
Automatically synchronise tasks, projects, time tracking and team workloads
Tailor visualisations to monitor KPIs that are specific to your team or industry
ClickUp is a top-tier project management platform. When paired with Power BI data visualisation features, it unlocks exceptional advantages. Below are some of the key benefits your organisation can achieve:
Project managers can create detailed dashboards in Power BI. This provides a complete overview of project progress. These dashboards allow them to visualise milestones, identify risks and track team performance metrics. All visualisations are presented in a clear and visually engaging format.
Integrating ClickUp data with other systems like finance and CRM allows business leaders to achieve a comprehensive overview of operations. This enables them to make more informed decisions.
Automating the data extraction process removes the need for manual exports. This helps to save significant time for analysts and project managers.
Power BI flexibility enables teams to design customised reports that align with specific business needs. Thus, offering more than the default reporting solutions available in ClickUp
With Vidi’s Power BI ClickUp Integration, you can turn raw call data into actionable insights for smarter decision-making.
Learn more about our connector below:


Challenge

Construction Site Management
A construction firm used ClickUp for project management but faced difficulties in tracking resource allocation and project timelines. Manual reporting led to delays and inefficiencies.
Solution

The firm used our ClickUp Power BI Connector to sync real-time project data with Power BI. They built dashboards to monitor resource utilisation, project progress and budget tracking.

Challenge
Software Development Workflow
A software development team needed to track sprint progress, bug resolution time and custom fields for client reporting.
Solution
The client used VIDI ClickUp Power BI connector to extract custom fields and task data. Client then built Power BI dashboards to visualise sprint metrics, bug trends and team performance.

Challenge
Demand Forecasting for a Retail Chain
A retail chain used ClickUp for task management, but struggled to forecast demand accurately. Manual processes led to overstocking and lost sales.
Solution
The chain implemented our ClickUp Power BI Connector to integrate task data with sales data. They built dashboards to analyse sales trends and predict demand.
We provide a no-code solution that pulls data from ClickUp into an Azure SQL Server database. This database can easily connect to Power BI through its built-in Azure SQL Server connector. The connection between Azure SQL Server and Power BI is highly reliable, even with large datasets, and enables our clients to implement additional data security measures within Azure.

Install
Find the ClickUp connector in our client portal and select ‘Install.’ This will generate all the necessary tables in your chosen database, where your data will be imported later.

Connect new company
Log in to your ClickUp account and choose one or more companies you wish to connect to.

Wait for the data to sync
The first refresh will take a few hours since it includes all past data. Later refreshes will be much faster, completing in minutes. Monitor the status in the refresh tab.

Install our free ClickUp Power BI template
Get our free ClickUp Power BI template to visualise your data in 5 minutes! You can easily customise the PBIX file later!
Our ClickUp Online Connector pulls data in an organised format, cutting down on hours of manual data preparation. You will get access to pre-built tables such as:
Additional customisations are available upon request.
You get a FREE dashboard when you purchase our connector
The template includes the following pages:
$1000 per year

14 days free trial

Unlimited number of ClickUp accounts

Unlimited Customer Support
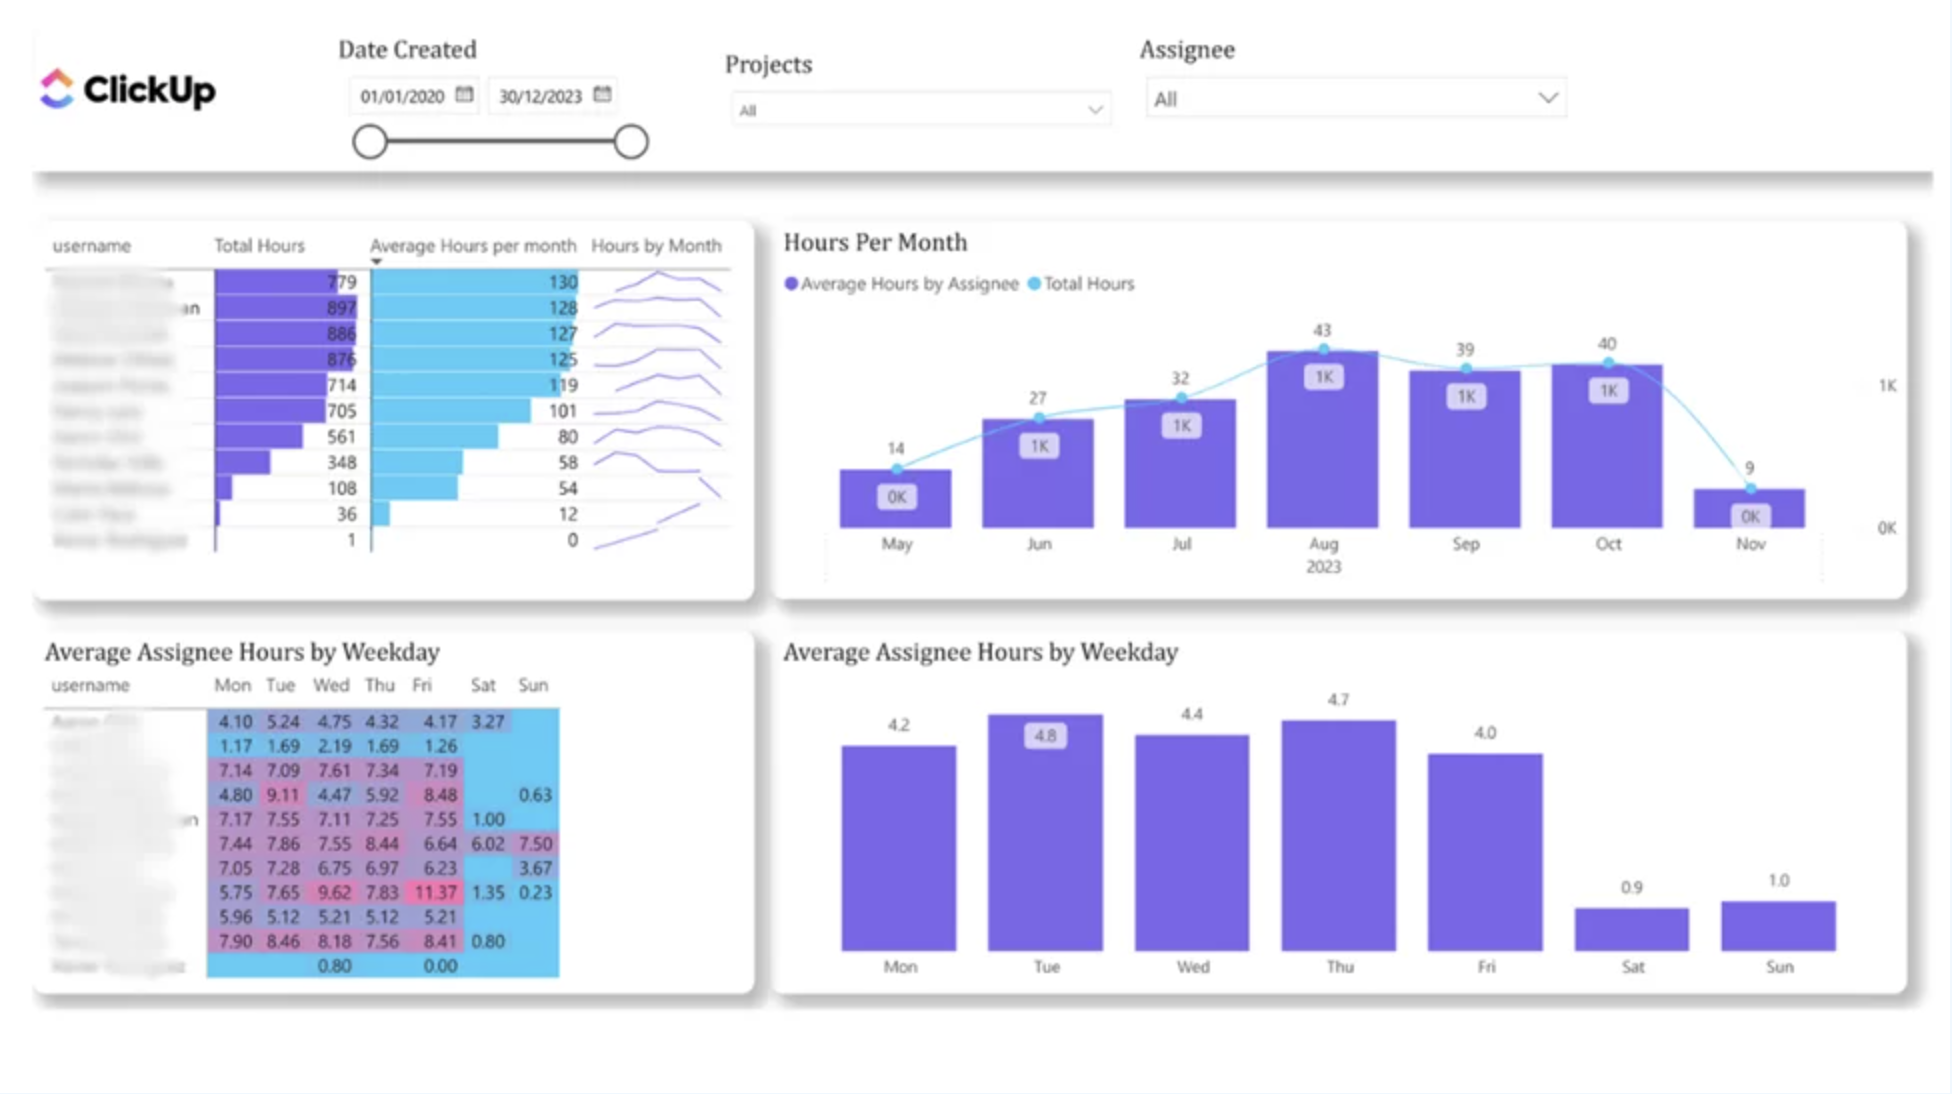
 Resource utilisation Visualised
 Project pipeline
 Task tracker Visualised
 Workload
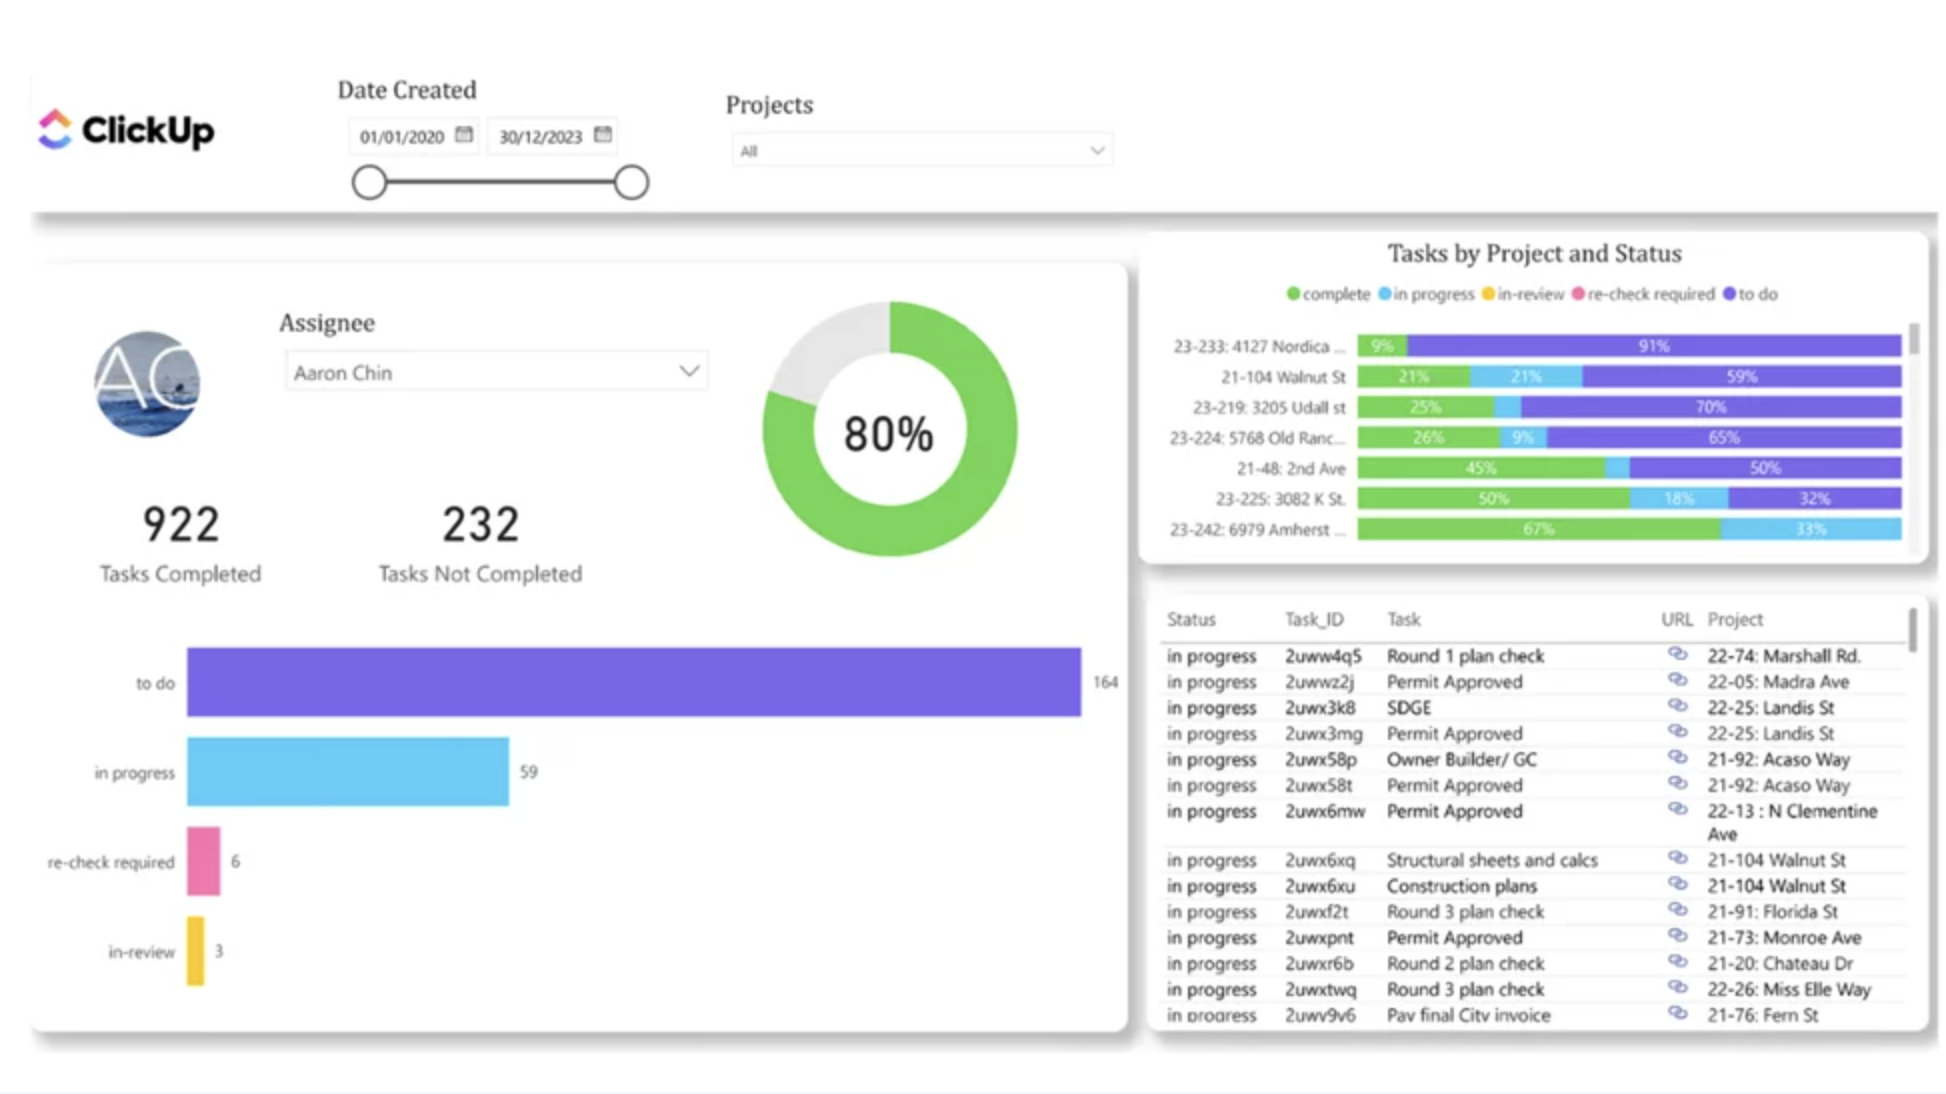
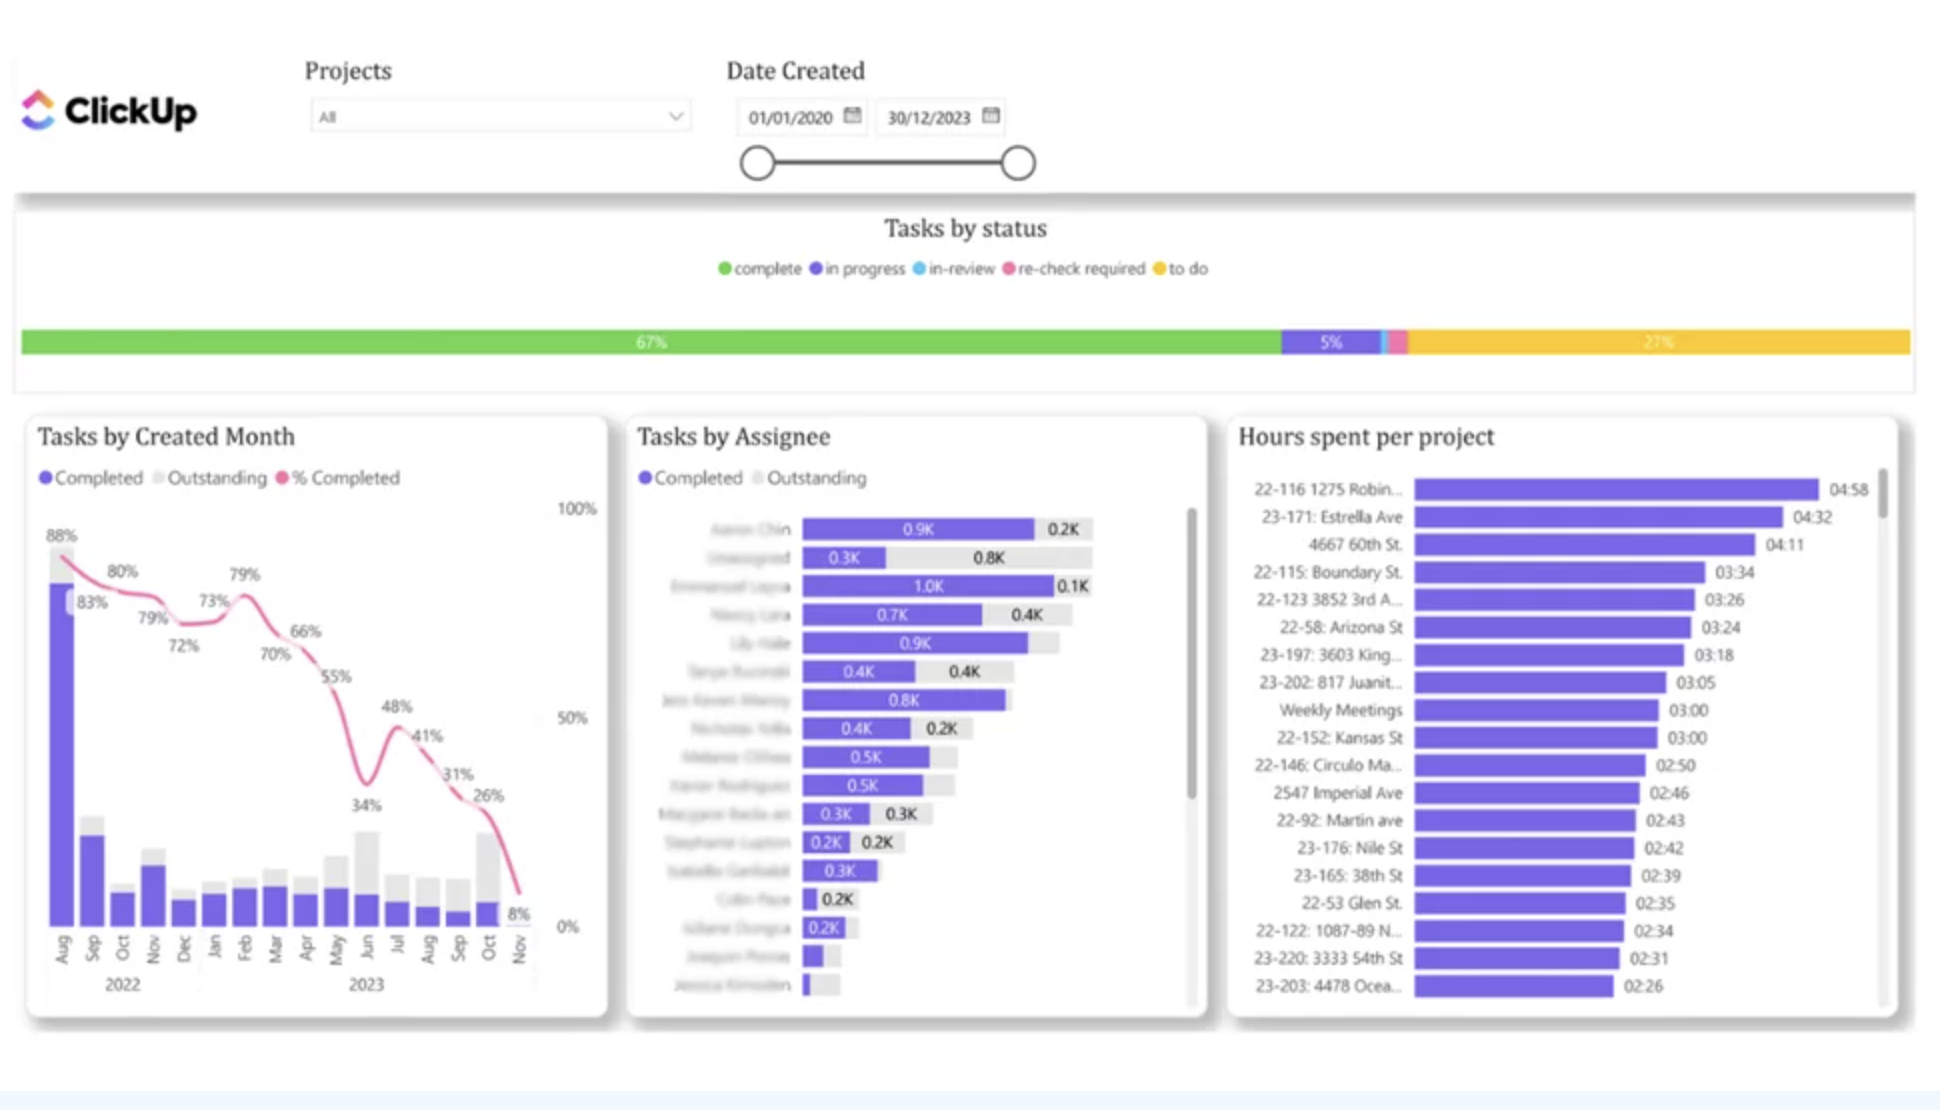
 Task status Visualised
 Cycle time
Great service and tools worked exactly as expected
Michael Khoury

The team at Vidi has been great to work with! Super responsive to my numerous questions, and even going so far as to help me learn and make small changeson my own.
Chris Ginsbach
Great group to work with, understood my needs and helped me design a solution that works
Michael Russell
![]()
![]()
![]()
