There have been many proven ways QuickBooks Online is transforming Businesses, on how they manage their finances and accounting. The cloud-based software has made it simpler than ever for entrepreneurs and small business owners to track their money and gain financial insights. At its core, QuickBooks was built to help entrepreneurs run their businesses. It gives critical visibility into financials to inform both day-to-day decisions and long-term strategic planning for the company across departments.
Here are 5 key ways QuickBooks Online is transforming small businesses:
One of the biggest advantages of QuickBooks Online is it gives business owners real-time visibility into their financial data from anywhere. As a cloud-based solution, QBO allows users to securely access reports and insights using any device that has an internet connection.
Business owners can check their profit & loss, view accounts receivable, track sales and expenses, monitor cash flow and more whether they are in the office, at home or travelling. This 24/7 financial access empowers smarter and faster data-driven decisions.
QuickBooks Online automates many of the manual, repetitive processes around accounting, bookkeeping and financial management.
Small teams no longer have to spend as much time reconciling bank accounts, creating invoices, tracking sales, managing payroll runs and more. Workflows become streamlined, human error is reduced and overall productivity goes up.
Integrations with POS systems, online stores, Stripe, PayPal, banks and more mean transaction data flows automatically into QBO. The software does the heavy number crunching, freeing up staff to focus on high-value tasks.
While the built-in reporting in QBO delivers many pre-configured financial statements, the custom reporting capabilities truly empower data-driven decisions.
Easy drag-and-drop custom reports allow users to analyze the exact metrics important for their business. Segment data by location, sales rep, product line and other dimensions to uncover trends and opportunities.
Compare time periods – is revenue growing month-over-month? How do margins compare year-over-year? QuickBooks Online provides the flexibility to visualize key numbers.
A key advantage of QuickBooks Online is the ability to securely share access to financial data with your team members and external accountants or bookkeepers.
Provide view-only or edit access to employees so they can enter expenses, view reporting and manage areas relevant to their role. Accountants can have continual visibility to ensure books are clean without needing to wait for data exports.
Collaborative access ultimately improves communication, transparency and better financial management across an organization.
At Vidi Corp, we solve a major pain point around integrating QuickBooks Online data with other platforms. Our QuickBooks Power BI Connector transforms QBO data into user-friendly datasets that connect directly with Power BI for custom reporting.
Why is this integration useful? Because while QuickBooks Online is a powerful accounting system, it forces users to jump between 100+ tables to analyze data. Our connector consolidates all that transactional data into clean sheets balanced by accounting standards.
The output can connect to any business intelligence tool like Power BI, Tableau or Looker Studio. With our connector, get pre-configured dashboards and reports for a 360-degree view of your company’s finances and operations.
QuickBooks Online delivers game-changing value to modern businesses – from anywhere access to real-time data to powerful custom reporting to ecosystem integrations. Solutions like the QuickBooks Power BI Connector by Vidi Corp further unlock financial insights from QBO data.
Stop wasting time manually recreating financial statements! Our QuickBooks connector integrates data from multiple QBO accounts into unified datasets to enable 360-degree financial reporting.
The QuickBooks Power BI Connector from Vidi Corp is an invaluable integration that solves major reporting challenges for QBO users. Specifically, the connector offers these transformative capabilities:
QuickBooks Online data is fragmented across hundreds of tables. Trying to manually consolidate this data into financial statements or reports is frustrating and time-consuming.
Our connector integrates all this transactional data from multiple QBO company files into easy-to-understand sheets and data models. All tied back to accounting standards for accuracy. Say goodbye to navigating complex, disconnected QBO tables!
While Power BI is the anchor reporting platform, our QBO connector’s output works across other platforms like Tableau and more.
Schedule automatic daily, weekly or monthly refreshes to keep QuickBooks reporting updated. Incremental refreshes make reprocessing efficient.
Combine data from different QuickBooks companies into unified reports quickly. Eliminate manual aggregation in Excel across different entities or subsidiaries.
Get up and running fast with connector license. Our pre-configured Power BI reports templates eliminate setup. Drag-and-drop to customize further for your unique KPIs.
The QuickBooks Power BI Connector saves endless hours by connecting scattered QBO data into unified datasets and reports. Stop manually recreating financial statements in Excel! Our connector integrates to BI tools for true 360-degree QuickBooks reporting at last.
Transform business insights today with the Vidi Corp QuickBooks Connector for effortless financial reporting!
Still not convinced? Let’s take a look at some case studies on how you will be able to use QuickBooks Online to enhance business profitability.
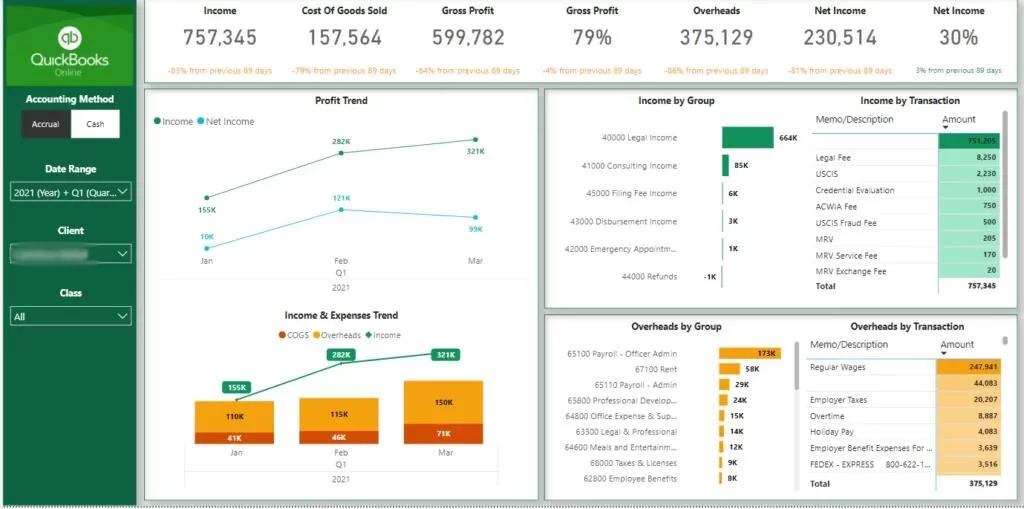
A manufacturing company was struggling with timely visibility into their profit & loss metrics across multiple locations. Their data was spread across many QuickBooks Online accounts. By leveraging the QuickBooks Online Power BI connector, they were able to rapidly consolidate data and build an interactive P&L dashboard.
The dashboard provides real-time insights into revenue, cost of goods sold, gross margins, operating expenses and net income by business units. Charts allow filtering by both region and product line. The finance team can now slice the P&L by different dimensions to uncover trends and opportunities. Refreshing the dashboard also ensures all data is current.
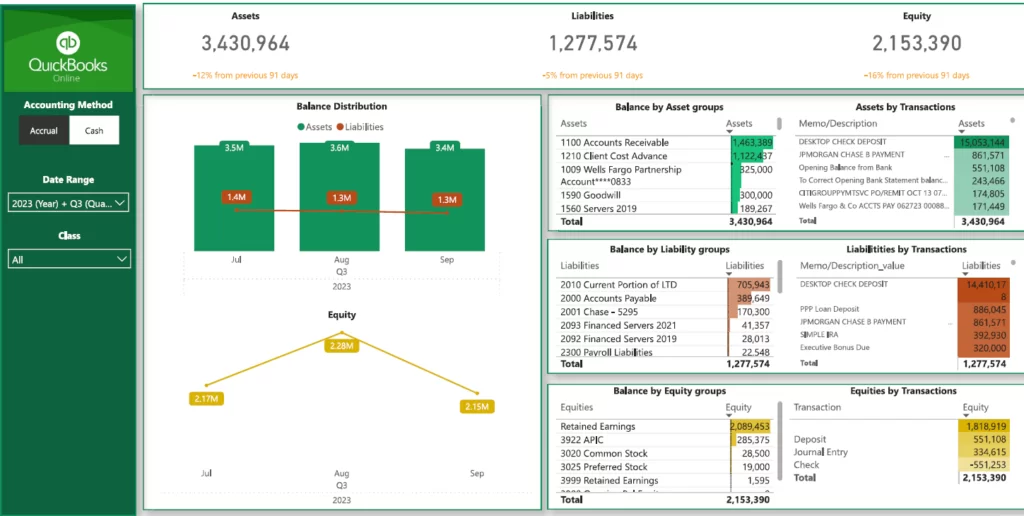
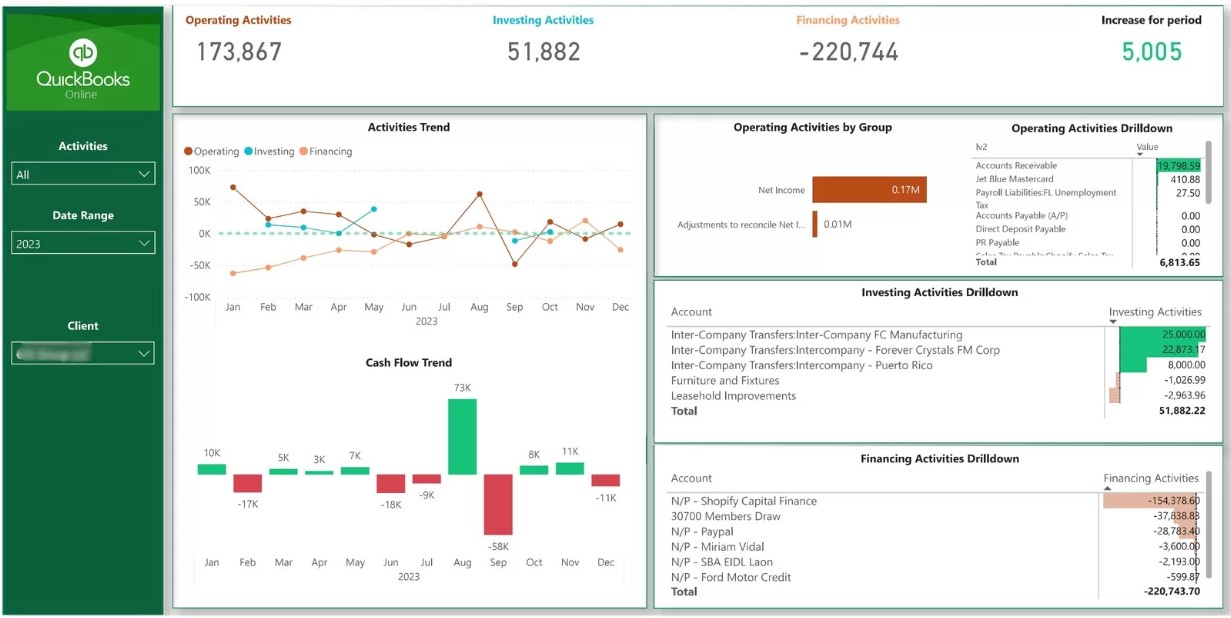
A retail company wanted better visibility into working capital, cash flow and balance sheet trends. However, they found QuickBooks reporting to be too fragmented and limiting. By integrating QBO with Power BI using the purpose-built connector, they built a customized balance sheet dashboard.
Key report features include visualizing current assets like cash, accounts receivable and inventory over prior periods. Liability metrics are also tracked over time including accounts payable, loans and deferred revenues. Net equity charts show retained earnings and shareholder interests. Cleaning connecting QBO with Power BI delivered a holistic balance sheet view they desperately needed.
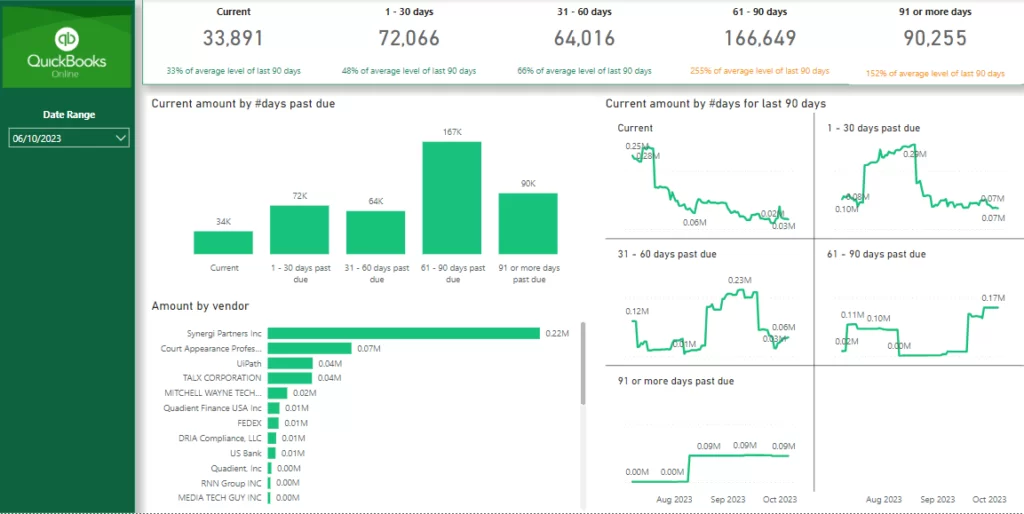
For any business, tracking accounts receivable and customer payments is mission critical. A services firm was wasting countless hours navigating receivables across disconnected QuickBooks screens and Excel exports. By leveraging the QuickBooks Power BI Connector, they automated an aging accounts receivable analysis dashboard.
The interactive dashboard breaks down total receivables by current, 30 days past due, 60 days past due and 90+ days past due. This allows them to track potential collection issues with older invoices. Drilling down by customer also identifies concentration exposure and credit risks across their client base. Automating the accounts receivable aging analysis has been a gamechanger for both their finance team and sales department.
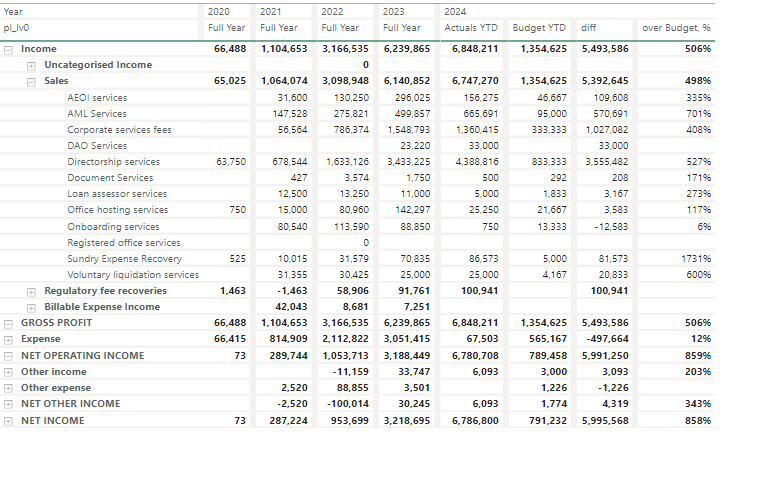
A fast-growing startup struggled with budgeting and variance analysis across their organization. Different departments used disconnected Excel sheets to track budgets. By utilizing the QuickBooks Online Power BI connector, they established a centralized Actuals vs Budget dashboard.
This custom report consolidates their departmental budgets established in QBO into a unified view. Actual spending and revenue data is shown against budgets for quick visual variance analysis. Trends are displayed both month-to-date as well as year-to-date. Visibility into budget vs actuals has streamlined their financial planning processes.
A consumer goods company wanted better insights into sales performance across product lines, customer segments and regions. However, their QuickBooks Online data was too fragmented across transactions. The QuickBooks Power BI connector enabled automated reporting on key sales KPIs.
Their new sales dashboard provides visibility into sales by product category over time as well as year-over-year comparisons. It segments transaction data by customer type and geography to uncover trends. Top customers are also displayed along with revenue concentration risks. Piping QBO data into Power BI has allowed them to make smarter decisions to drive growth.
If your small business still relies on outdated spreadsheets or legacy desktop software for financial management, it’s time to consider joining the millions of entrepreneurs leveraging QuickBooks Online. It will help you to transform how they control their money and operate efficiently.
The cloud-based accounting platform delivers unmatched simplicity, automation and insights that drive growth and profitability in today’s data-driven business landscape. In the meantime, get your dashboard created based out of QuickBooks to see how your business is doing financially at any given time.
![]()
![]()
![]()