
There are 2 types of benefits of Power BI: those that are unique to Power BI and those that are common for the whole BI tool market. The second type of benefits is shared by competitors of Power BI such as Tableau, Looker Studio and Domo.
The following benefits of Power BI are unique and not copied by any of the competitors:
The following benefits of Power BI are shared by the competitors including Tableau, Looker Studio, Domo and others:
Let’s now dive into each of these benefits of Power BI in more detail.
Chances are, you already use Microsoft products like Excel, Azure DevOps, Dynamics, SharePoint, and so on a daily basis. Power BI, being Microsoft-made itself, works well with these tools. What does it mean in practice?
Firstly, you can automatically extract data from all these tools into Power BI using native integrations. If the data you need to analyse is in any of those systems, you can connect to it with Power BI without coding. If you use a different BI tool, you would likely have to code these integrations from scratch.
Secondly, you can embed your Power BI reports to SharePoint sites and Teams channels where your team can view them. This makes sharing Power BI reports easier and integrates Power BI into existing workflows.
Finally, Microsoft sells their licenses in packages. If your organization pays for Microsoft Office E3 license, you already have access to the paid version of Power BI. If your company is already paying for it, why not explore it in more detail?
Microsoft Fabric is a web platform hosting all the workflows happening in Power BI, Azure Synapse, Azure Data Factory and a few other products. Each product would be used by a different data team function such as data engineers, data scientists and Power BI data analysts.
Admittedly, this Power BI benefit is more impactful for organizations with established data teams. Every data team member can connect to datasets used by other members which has multiple benefits:
You can read more about Microsoft Fabric in our other blog post if you are interested.
Power BI has many AI features but the most impressive one is Microsoft Co-pilot.
Microsoft co-pilot provides a chatbot-like functionality enabling the non-technical users to perform a range of tasks such as:
Co-pilot is really what separates Microsoft Power BI from competition.
Apart from that, there are other smaller scale AI features in Power BI including:
GitHub is universally accepted as a tool of choice for version control in the coding world. However, many BI tools don’t integrate with GitHub.
Power BI, on the other hand, offers a GitHub integration allowing users to keep track of different versions. Developers can also merge 2 versions of a Power BI report together and clearly view the differences between them using the GitHub integration.
The GitHub integration is especially useful for large projects that have multiple iterations. It allows the report development process to be much more organised.
This seems insignificant at first but compare it with Tableau publishing updates every 4 months or Looker releasing updates without a set schedule.
With Power BI you get new features and enhancements on a regular schedule. The stable update schedule allows many Power BI youtubers and bloggers that digest these features as soon as they come out.
The monthly update strategy is what enabled Microsoft to quickly catch up to Tableau in terms of the number of available features. This also means that in the long term you will likely have less limitations with Power BI than with any other BI tool.
Power BI is designed with simplicity in mind, so even if you’re not a data guru, you can create and interact with reports and dashboards without a hitch.
Its drag-and-drop interface lets you throw up visualizations quickly without needing advanced technical skills. Specifically, you can easily create a chart by selecting data and dragging it onto the workspace.
And if drag-and-drop turns out easier said than done, there are pre-built Power BI templates that you can use and tweak. All you have to do is connect your data source(s).
The user-friendliness of Power BI and availability of templates greatly reduces the learning curve for your team and this lets you get insights faster and focus on what really matters—making better business decisions.
Your data and insights are always protected in Power BI through data encryption, single-sign-on, etc. You can also choose data residency with Power BI which helps GDPR or HIPPA compliance. If you want to read more about Power BI data security measures, you can check out the Power BI security whitepaper.
At any given time, you can have peace of mind knowing that the wrong parties don’t have access to any data or insights stowed in Power BI.
There are also some security features that can be set up by Power BI report developers. For example you can also control who sees what within your Power BI reports and dashboards through Power BI’s Row-Level Security (RLS) feature.
For instance, if your report contains sales data for multiple regions, you can use RLS to ensure that team members only see the data for their assigned region.
This way, you can confidently share insights across your organization rest assured that sensitive information stays protected and unauthorized access is also prevented.
Apart from integrations with all the Microsoft services, Power BI also has out-of-the-box connectors to sources like Mailchimp, Survey Monkey, etc. In total there are 250+ connectors in Power BI which is more than in Tableau or Looker.
DOMO is the only BI software that has more connectors than Power BI. As of now, DOMO has 2000+ connectors and counting. However, DOMO is much more expensive and requires some SQL skills. You can read more about DOMO vs Power BI comparison on our blog.
Even if your company data is stored in multiple disparate sources, Power BI can connect to all of them and bring all your business data together in one place.
This breaks down silos and creates a single, reliable source of truth.
If the data you want to extract insights from is stored in a niche place like Facebook ads or ClickUp, you can still connect the data to Power BI using a custom connector or third-party connector.
The reason many companies turn to BI software is to automate their spreadsheet-based reports. Power BI can drive report automation in several ways:
Data extraction can be automated by using 250+ Power BI connectors. You can then schedule automatic refresh.
Data transformation can be automated in Power Query. As you transform the data, Power Query remembers the applied steps and runs then every time that the report is refreshed.
Power BI integration with Power Automate also allows to automate a range of reporting tasks such as exporting the Power BI reports to pdf and distributing them over email.
Power BI is mobile friendly so you can access your dashboards and reports anywhere, anytime.
Whether you’re in a meeting or on the go, you can check real time insights on your laptop, tablet, or phone.
There is also an alert feature that can send you notifications whenever there are important changes in your data, like a drop in sales or a spike in website traffic.
Power BI helps you stay connected to your data so you can respond faster to opportunities or challenges wherever you are.
Every department of every business can benefit from Power BI.
In this section, we’ll look at some examples of how Power BI has been used for different business purposes and teams.
N.B. All Dashboards displayed were built and delivered by Vidi Corp Power BI Consultancy.

Sales and marketing are what drives your business growth because they involve building customer relationships and revenue.
With a Power BI dashboard like the one below you can track follow up calls, potential leads, revenue, and orders in real time.
These insights can help you identify gaps in your sales and marketing effort.
Take for example, in the dashboard below, there’s a chart that shows how many follow up calls were made vs targets. If your team is short, you know you need to focus on customer outreach or lead follow ups. Fixing those gaps will help you close more deals and hit your sales targets.

Financial health is the lifeblood of your business and Power BI makes it easy to stay on top of your numbers.
The dashboard example below connects to financial data in QuickBooks using a convenient custom connector made by Vidi Corp.
It shows metrics and trends around income, profit, cost of goods sold (COGS), and net income.
Among many other things, you can quickly identify high expenses and take action to improve profitability and achieve your financial goals.
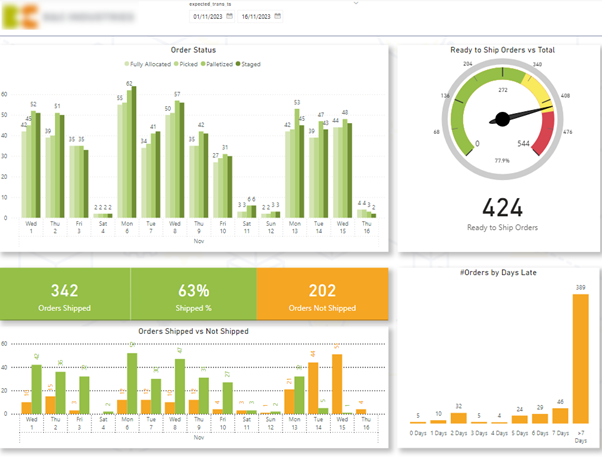
Efficiency in operations and supply chain is what keeps your business running.
As seen below, the dashboard shows turnover trends, product growth, and supplier performance.
The supplier and product growth analysis shows which ones are profitable and which are underperforming.
With this insight you can optimise inventory and focus on fast moving products.
This will help your business cut down on waste and costs while still delivering value to your customers.
Power BI can positively change how your business works with data. It offers many benefits that should not be overlooked such as its easy integration with other Microsoft Products, AI driven decision making, affordability, and real time insights, just to mention a few.
Every aspect of your business can gain value from Power BI—sales, marketing, finance, operations and HR.
If you want to get started with Power BI and unlock all the benefits, reach out to Vidi Corp for consultation or training.
![]()
![]()
![]()